Hey there, future AI expert! 👋
If you’re looking to master the confusion matrix for Class 10 CBSE AI, you’re in the right place. Remember when you first heard “Confusion Matrix” in class and thought, “Wait, if I’m confused, is that the matrix or just me?”
Trust me, you’re not alone. This is THE most Googled Question.. Here’s the thing: Confusion Matrix isn’t confusing once you see it the right way.
By the end of this guide, you’ll be calculating Accuracy, Precision, Recall, and F1 Score faster than your classmates can open their calculators. This is the most comprehensive confusion matrix class 10 tutorial you’ll find – complete with real CBSE board exam questions and solutions. Promise.
Why Confusion Matrix Matters for Class 10 AI Board Exams?
Board Exam Reality Check:
- 4-6 marks guaranteed in Theory paper (usually Q21 or Q22)
- 5 marks in Practical exam (Orange Data Mining evaluation)
- 5 marks in Viva (examiners LOVE asking about metrics)
That’s 14-16 marks just from understanding one concept. Worth your next 15 minutes, right?
What is a Confusion Matrix? (The Simple Answer)
The confusion matrix class 10 definition: A confusion matrix is a 2×2 table that shows how well your AI model is making predictions by organizing results into four categories.
Imagine you’re a doctor’s AI assistant. Your job is to predict if patients have diabetes or not based on their blood test results.
You test 100 patients. Here’s what happens:
- Sometimes you’re right: “Diabetes” → Actually has diabetes ✅
- Sometimes you’re wrong: “Diabetes” → Actually healthy ❌
- Sometimes you’re right: “Healthy” → Actually healthy ✅
- Sometimes you’re wrong: “Healthy” → Actually has diabetes ❌
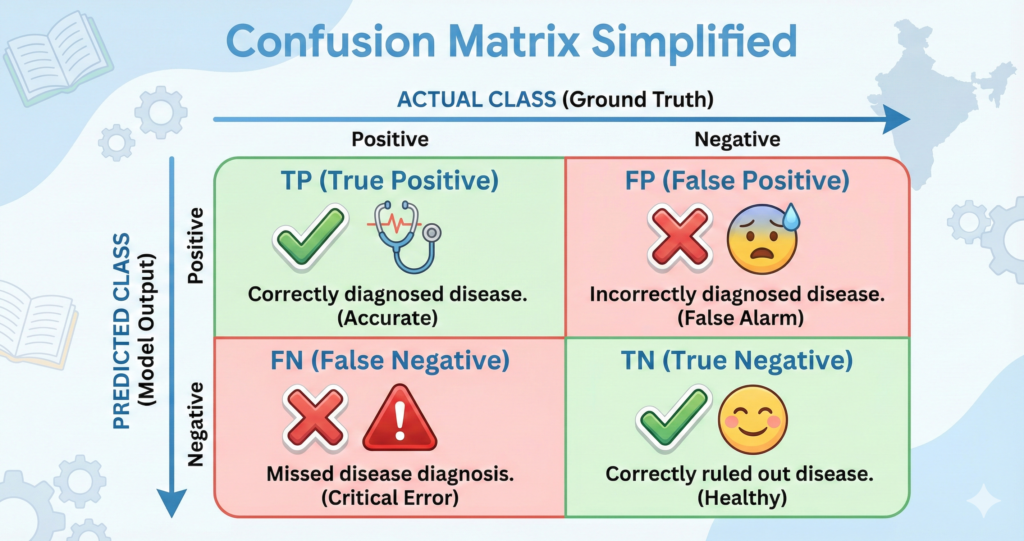
A Confusion Matrix is just a 2×2 table that organizes these four outcomes.
That’s it. Seriously. Everything else is just fancy names for these four boxes.
The Four Magic Boxes: Understanding the Matrix
Let me break down each box using the diabetes example:
Box 1: True Positive (TP) ✅
What it means: You predicted “Diabetes” → Patient actually has diabetes Real-life: You correctly identified sick patientsThink of it as: You were right about the bad news
Example: Out of 100 patients, you correctly identified 30 diabetic patients. TP = 30
Box 2: True Negative (TN) ✅
What it means: You predicted “Healthy” → Patient actually is healthy Real-life: You correctly identified healthy peopleThink of it as: You were right about the good news
Example: Out of 100 patients, you correctly identified 55 healthy patients. TN = 55
Box 3: False Positive (FP) ❌
What it means: You predicted “Diabetes” → Patient actually is healthy Real-life: You scared a healthy person unnecessarily Think of it as: False alarm! (Also called Type I Error)
Example: You wrongly told 5 healthy people they have diabetes. FP = 5
Why it matters: Imagine getting a cancer diagnosis, panicking, telling your family… then finding out it was wrong. That’s False Positive.
Box 4: False Negative (FN) ❌
What it means: You predicted “Healthy” → Patient actually has diabetes Real-life: You missed a sick person (they go untreated!) Think of it as: You missed the danger (Also called Type II Error)
Example: You told 10 diabetic patients they’re fine (they won’t get treatment). FN = 10
Why it matters: This is often WORSE than False Positive. Missing a disease can be deadly.
How to Draw a Confusion Matrix (Step-by-Step)
The Standard Format:
Here’s how to structure it:
| PREDICTED: Positive | PREDICTED: Negative | |
|---|---|---|
| ACTUAL: Positive | TP (True Positive) ✅ | FN (False Negative) ❌ |
| ACTUAL: Negative | FP (False Positive) ❌ | TN (True Negative) ✅ |
Memory Trick 🧠
Top row (ACTUAL Positive): True comes first
- Top-left: True Positive (TP)
- Top-right: False Negative (FN)
Bottom row (ACTUAL Negative): False comes first
- Bottom-left: False Positive (FP)
- Bottom-right: True Negative (TN)
Diagonal = Correct predictions (TP and TN) Off-diagonal = Mistakes (FP and FN)
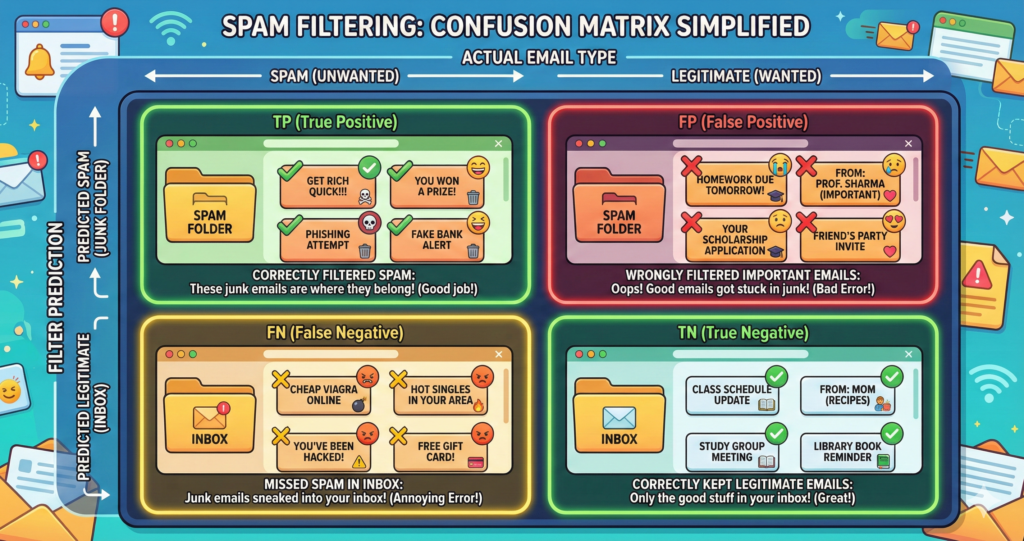
Filling Your First Confusion Matrix (Practice Example)
Scenario: A spam email filter tested on 200 emails.
- 80 emails were actually spam
- 120 emails were actually not spam (ham)
Results:
- Correctly identified 70 spam emails (TP)
- Correctly identified 100 ham emails (TN)
- Wrongly marked 20 ham as spam (FP) ← Your important emails went to spam folder!
- Missed 10 spam emails (FN) ← Spam reached your inbox
Let’s fill the matrix:
| PREDICTED: Spam | PREDICTED: Not Spam | Total | |
|---|---|---|---|
| ACTUAL: Spam | 70 (TP) ✅ | 10 (FN) ❌ | 80 |
| ACTUAL: Not Spam | 20 (FP) ❌ | 100 (TN) ✅ | 120 |
| Total | 90 | 110 | 200 |
Quick Check: TP + FN + FP + TN = 70 + 10 + 20 + 100 = 200 ✅
The Four Evaluation Metrics (This is Where Marks Come From)
Now that you have your confusion matrix, you calculate 4 important metrics. Examiners will give you the matrix and ask you to calculate these.
Metric 1: Accuracy (Overall Correctness)
Question it answers: “Out of all predictions, how many were correct?”
Formula:
Accuracy = (TP + TN) / (TP + TN + FP + FN) × 100%
In our spam example:
Accuracy = (70 + 100) / (70 + 100 + 20 + 10) × 100%
         = 170 / 200 × 100%
         = 85%
What it means: The model got 85% predictions right.
When to use: When both classes (spam/not spam) are equally important.
⚠️ WARNING: Accuracy can be misleading! Read the next example carefully:
The Accuracy Trap (CBSE Loves This!)
Scenario: COVID-19 test on 1000 people
- 990 people are actually healthy
- 10 people actually have COVID
Bad Model: Always predicts “Healthy” for everyone
Confusion Matrix:
| PREDICTED: COVID | PREDICTED: Healthy | Total | |
|---|---|---|---|
| ACTUAL: COVID | 0 (TP) | 10 (FN) | 10 |
| ACTUAL: Healthy | 0 (FP) | 990 (TN) | 990 |
| Total | 0 | 1000 | 1000 |
Accuracy = (0 + 990) / 1000 = 99% 😱
BUT this model is USELESS! It missed all 10 COVID patients (they’ll spread the disease).
Lesson: When data is imbalanced (one class is much larger), accuracy is a bad metric. We need better metrics…
Metric 2: Precision (How Accurate are Positive Predictions?)
Question it answers: “When I predict POSITIVE, how often am I correct?”
Formula:
Precision = TP / (TP + FP) × 100%
Think of it as: Of all the “alarms” you raised, how many were real?
Spam Filter Example:
Precision = 70 / (70 + 20) × 100%
          = 70 / 90 × 100%
          = 77.78%
What it means: When the filter says “This is spam,” it’s correct 78% of the time.
When Precision matters most:
- Spam filtering: False Positives are bad (important emails in spam folder)
- Legal system: Don’t jail innocent people
- YouTube copyright strikes: Don’t flag original content
High Precision = Fewer False Alarms
Metric 3: Recall (How Many Positives Did We Catch?)
Question it answers: “Of all the ACTUAL positives, how many did I find?”
Formula:
Recall = TP / (TP + FN) × 100%
Also called: Sensitivity, True Positive Rate (TPR)
Think of it as: How many needles did you find in the haystack?
Spam Filter Example:
Recall = 70 / (70 + 10) × 100%
       = 70 / 80 × 100%
       = 87.5%
What it means: The filter caught 87.5% of all spam emails (but missed 12.5%).
When Recall matters most:
- Cancer diagnosis: Don’t miss a single cancer patient (False Negatives are deadly)
- Fraud detection: Catch as many frauds as possible
- Terrorist screening: Better to check extra people than miss one
High Recall = Fewer Missed Cases
The Precision vs Recall Tradeoff (EXAM FAVORITE!)
You can’t maximize both. Here’s why:
Scenario 1: Your spam filter is STRICT (High Precision)
- Flags only obvious spam → Fewer false alarms (FP ↓)
- But misses some spam → More missed spam (FN ↑)
- Precision ↑, Recall ↓
Scenario 2: Your spam filter is LOOSE (High Recall)
- Flags anything suspicious → Catches all spam (FN ↓)
- But flags legitimate emails too → More false alarms (FP ↑)
- Recall ↑, Precision ↓
Exam Question Pattern:
“You’re building a COVID detection model. Should you optimize for Precision or Recall? Justify.”
Answer:
“Recall, because missing a COVID patient (False Negative) is more dangerous than a False Positive. Better to test extra people than miss infected ones.”
Metric 4: F1 Score (The Best of Both Worlds)
Question it answers: “What if I want BOTH precision and recall to be high?”
Formula:
F1 Score = 2 × (Precision × Recall) / (Precision + Recall)
Why it’s special: It’s the harmonic mean (not arithmetic mean) of Precision and Recall.
Spam Filter Example:
Precision = 77.78%
Recall = 87.5%

F1 = 2 × (77.78 × 87.5) / (77.78 + 87.5)
   = 2 × 6806.25 / 165.28
   = 13612.5 / 165.28
   = 82.35%
What it means: Balanced measure of model performance.
When to use F1 Score:
- When both False Positives and False Negatives are bad
- When data is imbalanced
- When you need ONE number to compare models
Special Property:
- If either Precision or Recall is very low, F1 will be low
- F1 = 1 (perfect) only when both P and R = 1
Complete Worked Example (Board Exam Style)
Question: An AI model diagnoses heart disease in 500 patients. The confusion matrix is:
[INSERT IMAGE 6: Heart Disease Example Diagram]
| PREDICTED: Disease | PREDICTED: Healthy | Total | |
|---|---|---|---|
| ACTUAL: Disease | 180 (TP) | 20 (FN) | 200 |
| ACTUAL: Healthy | 30 (FP) | 270 (TN) | 300 |
| Total | 210 | 290 | 500 |
Calculate:
- Accuracy
- Precision
- Recall
- F1 Score
- Which metric is most important for this problem? Why?
Solution:
Given:
- TP = 180 (correctly detected disease)
- TN = 270 (correctly detected healthy)
- FP = 30 (false alarm – told healthy person they’re sick)
- FN = 20 (missed disease – told sick person they’re healthy)
1. Accuracy:
Accuracy = (TP + TN) / Total
         = (180 + 270) / 500
         = 450 / 500
         = 0.90 or 90%
2. Precision:
Precision = TP / (TP + FP)
          = 180 / (180 + 30)
          = 180 / 210
          = 0.857 or 85.7%
What it means: When model says “Disease,” it’s correct 85.7% of the time.
3. Recall:
Recall = TP / (TP + FN)
       = 180 / (180 + 20)
       = 180 / 200
       = 0.90 or 90%
What it means: Model detected 90% of all actual disease cases (missed 10%).
4. F1 Score:
F1 = 2 × (Precision × Recall) / (Precision + Recall)
   = 2 × (0.857 × 0.90) / (0.857 + 0.90)
   = 2 × 0.7713 / 1.757
   = 1.5426 / 1.757
   = 0.878 or 87.8%
5. Most Important Metric:
Answer: Recall is most important for heart disease diagnosis.
Reasoning:
- False Negative (missing a disease) can be fatal
- False Positive (false alarm) is less dangerous – just do more tests
- Better to have 30 false alarms than miss 20 heart patients
- In medical diagnosis, we prioritize not missing any sick person
Common Mistakes Students Make (Avoid These!)
Mistake 1: Confusing Rows and Columns
When solving confusion matrix class 10 problems, students often make these errors. Learn from them:
❌ Wrong: Putting Predicted on rows, Actual on columns ✅ Correct: ACTUAL on rows (Y-axis), PREDICTED on columns (X-axis)
Mistake 2: Mixing Up FP and FN
❌ Wrong: “False Positive means I predicted Negative but actual was Positive” ✅ Correct: “False Positive means I predicted POSITIVE but actual was NEGATIVE (false alarm)”
Memory Trick: The first word (False/True) describes PREDICTION.
- False Positive = Predicted Positive falsely
- True Positive = Predicted Positive truly
Mistake 3: Wrong Formula for Precision/Recall
❌ Wrong: Precision = TP / (TP + TN) ✅ Correct: Precision = TP / (TP + FP)
Remember: Precision looks at the PREDICTED POSITIVE column only.
Mistake 4: Forgetting ×100 for Percentage
- Formulas give decimal (e.g., 0.85)
- Board exams often expect percentage (85%)
- Always multiply by 100 or write “× 100%” in formula
Quick Reference Formulas (Screenshot This!)
| Metric | Formula | What it Measures |
|---|---|---|
| Accuracy | (TP + TN) / (TP + TN + FP + FN) | Overall correctness |
| Precision | TP / (TP + FP) | Quality of positive predictions |
| Recall | TP / (TP + FN) | Coverage of actual positives |
| F1 Score | 2 × (P × R) / (P + R) | Balance of Precision & Recall |
Bonus Formulas (Sometimes Asked):
- Specificity (True Negative Rate): TN / (TN + FP)
- False Positive Rate: FP / (FP + TN)
Practice Problems (Solve These Now!)
Let’s practice what you’ve learned about confusion matrix class 10 concepts with real exam-style problem
Problem 1: Email Spam Filter
Your spam filter tested 1000 emails:
- 400 were actually spam, 600 were ham
- Correctly caught 350 spam (TP)
- Wrongly flagged 50 ham as spam (FP)
Questions:
- Draw the confusion matrix
- Calculate Accuracy, Precision, Recall, F1
- Is this a good spam filter? Explain.
<details> <summary>👉 Click to See Solution</summary>
Confusion Matrix:
- TP = 350
- FP = 50
- FN = 400 – 350 = 50
- TN = 600 – 50 = 550
| PREDICTED: Spam | PREDICTED: Ham | Total | |
|---|---|---|---|
| ACTUAL: Spam | 350 (TP) | 50 (FN) | 400 |
| ACTUAL: Ham | 50 (FP) | 550 (TN) | 600 |
| Total | 400 | 600 | 1000 |
Calculations:
- Accuracy = (350 + 550) / 1000 = 90%
- Precision = 350 / (350 + 50) = 87.5%
- Recall = 350 / (350 + 50) = 87.5%
- F1 = 2 × (87.5 × 87.5) / (87.5 + 87.5) = 87.5%
Evaluation: Good filter! 90% accuracy, balanced precision and recall. Only 50 false alarms and missed 50 spam.</details>
Problem 2: COVID-19 Testing (Imbalanced Data)
Hospital tests 1000 people:
- 50 actually have COVID, 950 are healthy
- Correctly identified 45 COVID patients (TP)
- Wrongly told 20 healthy people they have COVID (FP)
Questions:
- Fill the confusion matrix
- Calculate all 4 metrics
- Why is accuracy misleading here?
<details> <summary>👉 Click to See Solution</summary>
Matrix:
- TP = 45
- FP = 20
- FN = 50 – 45 = 5
- TN = 950 – 20 = 930
Metrics:
- Accuracy = (45 + 930) / 1000 = 97.5%
- Precision = 45 / (45 + 20) = 69.2%
- Recall = 45 / (45 + 5) = 90%
- F1 = 2 × (69.2 × 90) / (69.2 + 90) = 78.3%
Why accuracy is misleading:
- 97.5% looks great!
- But precision is only 69% (lots of false alarms)
- More importantly, even a dumb model that always says “Healthy” would get 95% accuracy (because 95% are actually healthy)
- F1 Score (78.3%) gives a more realistic picture
How This Appears in Orange Data Mining (Practical Exam)
In your Class 10 AI practical exam, you’ll use Orange Data Mining tool. After training a model, you’ll see a confusion matrix like this:
Orange Output:
| Cat | Dog | Bird | |
|---|---|---|---|
| Cat | 85 ✅ | 3 ❌ | 2 ❌ |
| Dog | 5 ❌ | 92 ✅ | 3 ❌ |
| Bird | 2 ❌ | 4 ❌ | 94 ✅ |
This is a 3-class matrix (not binary), but same logic:
- Diagonal = Correct predictions (85 + 92 + 94)
- Off-diagonal = Mistakes
For multi-class, calculate metrics for each class:
- Cat Precision = 85 / (85 + 5 + 2) = 92.4%
- Cat Recall = 85 / (85 + 3 + 2) = 94.4%
Don’t panic in exam! Just identify TP, FP, FN for the class they ask about.
Exam Tips: How to Score Full Marks
For 2-Mark Questions:
✅ Write the formula first (1 mark) ✅ Show calculation with values (1 mark)
Example:
Q: Calculate Precision. TP=30, FP=5
Answer: Precision = TP / (TP + FP) = 30 / (30 + 5) = 30 / 35 = 0.857 or 85.7%
For 4-Mark Questions:
✅ Draw the confusion matrix (1 mark) ✅ Calculate 2 metrics (2 marks) ✅ Explain which metric is important and why (1 mark)
For Viva:
Favorite Questions:
- “What is the difference between Precision and Recall?”
- “When would you use F1 Score instead of Accuracy?”
- “Explain False Positive and False Negative with examples”
Pro Tip: Always give medical examples (easy to relate, examiners love them).
Real-World Applications (For Understanding)
1. YouTube Copyright Detection
- High Precision needed: Don’t flag original content (False Positive ruins creators)
- Recall less important: Missing some pirated videos is acceptable
2. Cancer Screening
- High Recall needed: Don’t miss any cancer patient (False Negative is deadly)
- Precision less important: False alarms can be verified with more tests
3. Face Unlock on Phone
- Balance needed:
- Don’t unlock for wrong person (Precision)
- Don’t lock out the owner (Recall)
- That’s why F1 Score matters!
Summary: The 5 Things You MUST Remember
- Confusion Matrix = 4 boxes: TP, TN, FP, FN
- Diagonal = Correct, Off-diagonal = Mistakes
- Accuracy = Overall correctness (misleading with imbalanced data)
- Precision = Of my positive predictions, how many were correct?
- Use when False Positives are costly
- Recall = Of all actual positives, how many did I catch?
- Use when False Negatives are dangerous
- F1 Score = Harmonic mean of Precision and Recall
- Use when you want balance
You’ve now mastered the confusion matrix for Class 10 CBSE AI! With these concepts clear, you’re ready to tackle any evaluation question in your board exams.
What’s Next?
Now that you’ve mastered Confusion Matrix, you should learn:
- Train-Test Split – Why we split data 80-20
- Overfitting vs Underfitting – Why models fail
- Orange Data Mining Tutorial – Build your first model
- AI Evaluation MCQs – Practice 50 questions
If this helped you, share it with your classmates – let’s make AI easier for everyone.