Your class 12 AI viva questions is worth 5 marks in Class 12 AI (Subject Code 843). It is based on your Capstone Project and Practical File. Most students lose marks not because they don’t know the content — but because they haven’t practised saying the answers out loud, in the right format, at the right length.
This guide gives you 40 viva questions with model answers drawn directly from the Class 12 AI 2025-26 syllabus. Read them, understand them, then practice saying them without looking.
What You’ll Learn
- The exact format examiners expect for viva answers
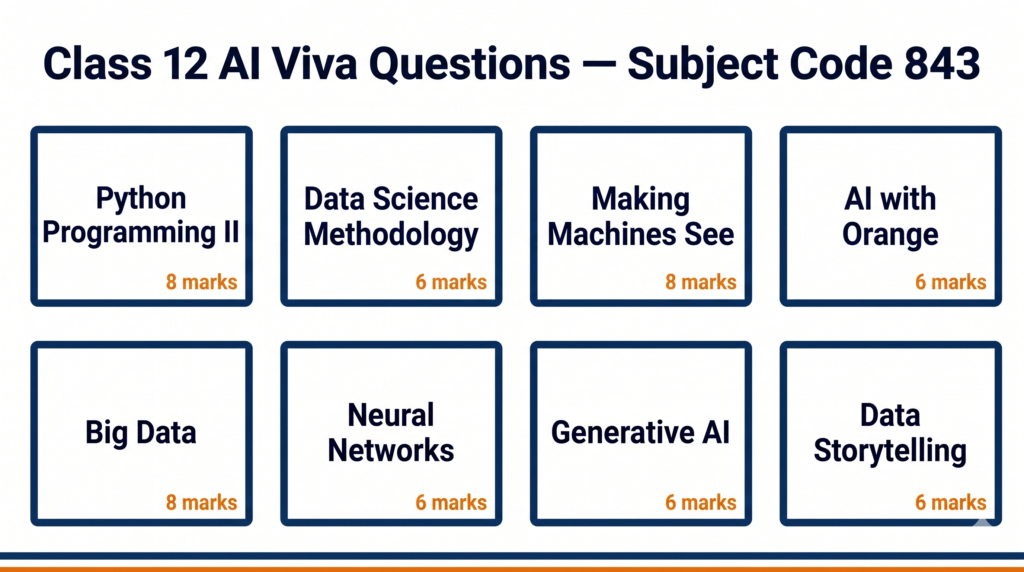
- 40 questions covering all 8 units of Class 12 AI (Part B)
- How to handle code-reading questions in the viva
- What to say when you don’t know the full answer
- How the 5 viva marks are actually distributed
How Class 12 AI Viva Questions Are Marked
The Class 12 AI viva is part of Part C (Practical Work). Here is the exact breakdown from the CBSE 2025-26 curriculum:
| Component | Marks |
|---|---|
| Capstone Project + Project Documentation + Video | 25 |
| Practical File | 10 |
| Lab Test (Python and Orange Data Mining) | 10 |
| Viva Voce (Capstone Project + Practical File) | 5 |
| Total (Part C) | 50 |
The viva examiner will ask questions on two things: your Capstone Project and your Practical File programs. They are not testing memorised definitions — they are testing whether you actually did the work and understand what you did.
Section 1: Python Programming – II (Unit 1)
Q1. What is a Pandas DataFrame? How is it different from a NumPy array?
A DataFrame is a two-dimensional, labelled data structure in Pandas. It has rows and columns, like a table in Excel. A NumPy array is also two-dimensional but has no column labels — every element must be the same data type. A DataFrame can have different data types in different columns. In my practical file, I used a DataFrame to load a CSV file and check for missing values.
Q2. How do you handle missing values in a Pandas DataFrame?
There are two main approaches. You can drop the rows or columns that have missing values using dropna(), or you can fill the missing values with a substitute — like the mean, median, or a fixed value — using fillna(). Which method you choose depends on how many values are missing and whether the missing data is random or follows a pattern.
Q3. What does df.describe() do?
It gives a statistical summary of all numeric columns in the DataFrame. It shows the count, mean, standard deviation, minimum value, the 25th percentile, median (50th percentile), 75th percentile, and maximum value. It is the fastest way to get an overview of your data before analysis.
Q4. An examiner shows you this code. What does it do?
import pandas as pd
df = pd.read_csv("students.csv")
df.dropna(inplace=True)
print(df.shape)
This code imports the Pandas library, reads a CSV file called students.csv into a DataFrame called df, removes all rows that contain any missing values (inplace=True means it changes the original DataFrame without creating a copy), and then prints the number of rows and columns remaining.
Q5. What is Linear Regression? Is it in your practical file?
Linear Regression is an algorithm that finds the best straight line through a set of data points to predict a numeric output. For example, predicting a student’s marks based on hours studied. In the Class 12 syllabus, implementing Linear Regression in Python is marked as “For Advanced Learners” — it is evaluated in practicals only. [Note for examiner: my practical file includes/does not include this program depending on what my teacher assigned.]
Section 2: Data Science Methodology (Unit 2)
Q6. What are the steps of the Data Science Methodology?
The Data Science Methodology has six steps: Problem Definition, Data Collection, Data Preparation, Model Building, Model Evaluation, and Deployment. In the Capstone Project, we follow all these steps — we start with a problem, collect or use a given dataset, clean and prepare the data, build a model using Orange or Python, evaluate it using metrics like accuracy and F1 score, and then present the results.
Q7. What is the difference between MSE and RMSE?
MSE stands for Mean Squared Error. It is the average of the squared differences between predicted and actual values. RMSE is Root Mean Squared Error — it is simply the square root of MSE. RMSE is more useful because it is in the same units as the original data, making it easier to interpret. A lower MSE or RMSE means the model’s predictions are closer to the actual values.
Q8. What is train-test split and why do we do it?
Train-test split means dividing the dataset into two parts — one for training the model and one for testing it. We typically use 80% of the data for training and 20% for testing. The reason is to check whether our model generalises well to new, unseen data. If we train and test on the same data, the model appears to perform well but may actually be memorising the data rather than learning patterns — this is called overfitting.
Q9. What is a confusion matrix? Can you explain the four values?
A confusion matrix is a table that shows how well a classification model performs. It has four values: True Positive (TP) — the model correctly predicted the positive class; True Negative (TN) — correctly predicted the negative class; False Positive (FP) — predicted positive but it was actually negative (also called Type I error); False Negative (FN) — predicted negative but it was actually positive (also called Type II error).
Q10. How do you calculate Precision, Recall, and F1 Score?
Precision = TP / (TP + FP). It answers: of all the cases I predicted as positive, how many were actually positive?
Recall = TP / (TP + FN). It answers: of all the actual positive cases, how many did I correctly identify?
F1 Score = 2 × (Precision × Recall) / (Precision + Recall). It is the harmonic mean of precision and recall, useful when there is a class imbalance in the data.
Section 3: Computer Vision / Making Machines See (Unit 3)
Q11. What is Computer Vision?
Computer Vision is a field of AI that teaches machines to interpret and understand visual information from images or videos. It enables applications like face recognition, medical image analysis, self-driving cars, and quality inspection in manufacturing. In the Class 12 AI curriculum, we study how machines process visual data and work with OpenCV.
Q12. What are the key stages of the Computer Vision process?
The Computer Vision process has five stages: Image Acquisition (capturing the image), Preprocessing (resizing, converting to grayscale, removing noise), Feature Extraction (identifying edges, shapes, or patterns), Classification or Detection (deciding what the image contains), and Output or Action (what the system does with that information).
Q13. What did you do in your practical file for Computer Vision?
In my practical file, I used OpenCV to load, display, and resize images. The key functions I used were cv2.imread() to read an image, cv2.imshow() to display it, cv2.resize() to change its dimensions, and cv2.cvtColor() to convert between colour formats like BGR to grayscale. [Adapt this to match what you actually submitted.]
Q14. An examiner shows you this code. Explain what it does.
import cv2
img = cv2.imread("photo.jpg")
gray = cv2.cvtColor(img, cv2.COLOR_BGR2GRAY)
cv2.imwrite("gray_photo.jpg", gray)
This code reads an image called photo.jpg using OpenCV, converts it from BGR colour format to grayscale using cvtColor, and then saves the grayscale version as a new file called gray_photo.jpg. We convert to grayscale to simplify the image data before applying further processing like edge detection.
Section 4: AI with Orange Data Mining Tool (Unit 4)
Q15. What is Orange Data Mining and why do we use it in Class 12 AI?
Orange is a free, open-source visual programming tool for data science and machine learning. We use it because it lets you build machine learning pipelines by connecting widgets — without writing code. In Class 12 AI, Orange is used for data visualisation, classification, and model evaluation. Unit 4 is evaluated only in practicals.
Q16. What did you do in your Orange practical file programs?
In my Orange practical file, I performed data visualisation using the Data Table and various chart widgets, built a classification model using the Naive Bayes or kNN classifier widget, evaluated the model using the Confusion Matrix widget, and performed image analytics using the Image Viewer widget. I also created a word cloud to visualise word frequencies. [Adapt to match your actual submissions.]
Q17. How do you evaluate a model in Orange?
In Orange, you connect your dataset to a Test and Score widget, which gives metrics like accuracy, precision, recall, and F1 score for the model. You can also connect a Confusion Matrix widget to see exactly which classes are being misclassified. These are the same metrics we calculate manually in theory — Orange just automates the calculation.
Section 5: Big Data and Data Analytics (Unit 5)
Q18. What is Big Data? What are the 3 Vs?
Big Data refers to datasets that are so large and complex that traditional data processing tools cannot handle them efficiently. The 3 Vs define Big Data: Volume (the sheer amount of data generated), Velocity (the speed at which data is generated and needs to be processed), and Variety (the different types of data — structured, semi-structured, and unstructured). Some definitions add a fourth V: Veracity, meaning the reliability or accuracy of the data.
Q19. What is the difference between structured and unstructured data? Give examples.
Structured data is organised in a fixed format — rows and columns — like data in an Excel sheet or a relational database. Examples include student mark sheets, bank transaction records, and inventory tables. Unstructured data has no fixed format. Examples include text messages, social media posts, images, audio files, and videos. Most of the data generated in the world today is unstructured.
Q20. What tools are used for Big Data processing?
Common tools for Big Data processing include Hadoop (for distributed storage and batch processing), Spark (for fast, in-memory processing), Hive (for querying large datasets using SQL-like syntax), and Kafka (for real-time data streaming). In the Class 12 AI curriculum, we study these conceptually rather than implementing them in code.
Section 6: Neural Networks (Unit 6)
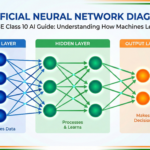
Q21. What is a neural network? What are its basic components?
A neural network is a computational model inspired by the human brain. It consists of layers of interconnected nodes called neurons. The three main components are: the Input Layer (which receives the data), Hidden Layers (which perform computations and extract patterns), and the Output Layer (which gives the final result). Each connection between neurons has a weight that is adjusted during training.
Q22. What is the difference between ANN, CNN, and RNN?
ANN (Artificial Neural Network) is the general term for any neural network with fully connected layers — it processes tabular or flat data well. CNN (Convolutional Neural Network) is designed specifically for image data — it uses convolutional filters to detect features like edges and shapes. RNN (Recurrent Neural Network) is designed for sequential data like time series or text — it has loops that allow information to persist from one step to the next.
Q23. What is overfitting in a neural network? How do you prevent it?
Overfitting happens when a neural network learns the training data too well — including its noise and random fluctuations — and performs poorly on new data. You can prevent overfitting by using more training data, adding dropout layers (which randomly disable neurons during training), using regularisation (L1 or L2), or stopping training early when the validation loss starts to increase.
Q24. What does TensorFlow Playground show?
TensorFlow Playground is a visual tool that lets you watch a neural network train in real time. You can change the number of hidden layers, the number of neurons per layer, the activation function, and the learning rate. It shows how the network’s decision boundary changes as it trains. In Class 12 AI, we use it to build intuition about how neural networks learn without writing full code.
Q25. You are shown this Python code. What does it do?
import tensorflow as tf
model = tf.keras.Sequential([
    tf.keras.layers.Dense(10, activation='relu', input_shape=(1,)),
    tf.keras.layers.Dense(1)
])
model.compile(optimizer='adam', loss='mse')
This creates a simple neural network using Keras (which is part of TensorFlow). It has one hidden layer with 10 neurons and ReLU activation, and one output layer with 1 neuron (for regression). The model is compiled with the Adam optimiser and Mean Squared Error as the loss function — this setup is appropriate for a regression task like predicting temperature.
Section 7: Generative AI (Unit 7)
Q26. What is Generative AI? How is it different from Discriminative AI?
Generative AI creates new content — text, images, audio, or code — by learning patterns from existing data. Discriminative AI classifies or distinguishes between categories. For example, a spam filter that labels emails as spam or not spam is discriminative. A model that writes new emails or generates images from a text description is generative. ChatGPT and DALL·E are examples of Generative AI. A logistic regression classifier is an example of Discriminative AI.
Q27. What is a Large Language Model (LLM)? Give an example.
A Large Language Model is a type of Generative AI model trained on massive amounts of text data. It learns patterns in language and can generate coherent, contextually relevant text. Examples include GPT-4 (used in ChatGPT), Google Gemini, and Anthropic’s Claude. LLMs are trained using a technique called self-supervised learning on billions of words from books, websites, and other text sources.
Q28. What are the ethical concerns with Generative AI?
The main ethical concerns are: Misinformation (AI can generate convincing but false content — deepfakes, fake news); Copyright and Ownership (AI is trained on human-created content, raising questions about who owns the output); Bias (models can perpetuate biases present in training data); Job Displacement (automation of creative and knowledge work); and Privacy (models may inadvertently memorise and reproduce personal information from training data).
Q29. What is a prompt in the context of Generative AI?
A prompt is the input you give to a Generative AI model — the instruction or question that tells the model what output to produce. For example, “Write a poem about the monsoon” is a prompt. Prompt engineering is the skill of designing prompts carefully to get better, more accurate, or more useful outputs from AI models. In Class 12 AI practicals, we use the Gemini API to create prompts and generate outputs.
Q30. You built a chatbot using the Gemini API. How does it work?
The Gemini API is Google’s interface for accessing the Gemini language model. To build a chatbot, you write Python code that sends a text prompt to the API and receives a text response. The program takes user input, passes it to the API using an API key for authentication, and prints the model’s reply. This is the “For Advanced Learners” activity in Unit 7. [If you did not complete this, say: “My teacher demonstrated this activity in class. The chatbot works by sending user input to the API and displaying the model’s response.”]
Section 8: Data Storytelling (Unit 8)
Q31. What is Data Storytelling?
Data Storytelling is the practice of communicating insights from data through a combination of data, visualisations, and narrative. A data story has three components: the data (facts and analysis), the visualisation (charts, graphs, or diagrams that make the data visible), and the narrative (the explanation that connects the data to a conclusion or recommendation). The goal is to make data understandable and persuasive for a non-technical audience.
Q32. What types of visualisations did you use in your Data Story?
I used a bar chart to compare categories, a line graph to show trends over time, and a scatter plot to show relationships between two variables. [Adapt to match what you actually submitted in your Practical File.] The choice of visualisation depends on what you want to show — bar charts for comparisons, line charts for trends, pie charts for proportions, and scatter plots for correlations.
Q33. What is the difference between a bar chart and a histogram?
A bar chart displays data in discrete categories — the bars do not touch each other. A histogram displays the distribution of continuous numeric data — the bars touch because the data is grouped into continuous intervals (called bins). For example, showing how many students scored in the range 0–20, 21–40, 41–60, etc. is a histogram; showing how many students are in each class section is a bar chart.
Capstone Project Questions
Q34. What problem did your Capstone Project solve? Why did you choose it?
[This answer must be specific to your project. Structure it like this:] My Capstone Project is titled [Project Title]. The problem it addresses is [describe the problem in one sentence]. I chose this problem because [reason — relevance to real life, available dataset, connection to syllabus topics]. The project follows the Data Science Methodology — I defined the problem, collected data from [source], prepared the data by handling missing values and normalising it, built a model using [tool/algorithm], and evaluated it using [metrics].
Q35. What dataset did you use? Where did you get it?
I used [dataset name] from [source — Kaggle, UCI Machine Learning Repository, or a dataset provided by my teacher]. The dataset has [number] rows and [number] columns. The target variable (what I was trying to predict or classify) is [column name]. I cleaned the dataset by [what you did — removing duplicates, filling missing values, etc.].
Q36. How did you evaluate your model? What was the accuracy?
I evaluated my model using [accuracy / precision / recall / F1 score / RMSE — as applicable]. My model achieved [X]% accuracy on the test set. [If accuracy was low, be ready to explain why: “The accuracy was 72% because the dataset was small / the classes were imbalanced / I used a simple model.”] I used a train-test split of 80:20.
Q37. What challenges did you face in your project and how did you solve them?
[Answer honestly. Common genuine challenges include:] The dataset had many missing values — I solved this by filling them with the column mean. The model was initially overfitting — I reduced the number of features and used a simpler algorithm. I had difficulty connecting the Orange widgets in the correct sequence — I referred to the Orange documentation and my teacher’s guidance to resolve it.
Q38. What would you improve in your project if you had more time?
If I had more time, I would collect a larger and more diverse dataset to improve model accuracy. I would also try comparing two or three different algorithms to see which performs best on my problem. I would like to add a simple web interface so that users can input data and see the prediction directly, rather than running Python code.
Handling Difficult Viva Moments
Q39. What do you say if you don’t know an answer?
Never say “I don’t know” and stop. Instead, say: “I am not fully certain of the exact answer, but based on what I know about [related concept], I believe it works like this…” Then explain what you do know. Examiners give partial credit for logical reasoning even when the exact answer is incomplete. What they penalise is silence or an obvious bluff.
Q40. How should you answer a code-reading question you haven’t seen before?
Read the code line by line out loud. Start with the import statements — they tell you which libraries are being used. Then identify variables and what data they hold. Then explain what each function call does. Finish by describing what the code produces as output. You do not need to have memorised every function — if you explain the logic correctly, you will score well.
Quick Revision Box
Before your viva, confirm you can:
☑ State the exact marks breakdown for Part C (Practical) without looking
☑ Explain the four values in a confusion matrix with examples
☑ Describe what your Capstone Project does in two sentences
☑ Read and explain a short Python DataFrame or OpenCV code snippet
☑ Explain the difference between Generative and Discriminative AI
☐ Answer all 40 questions above without checking your notes
→ [Viva Prep Pack coming soon — full 843 question bank with examiner notes]
Practice Questions
Q1. Your model has Precision = 0.90 and Recall = 0.60. Calculate the F1 Score. What does this result tell you about the model?
Model Answer: F1 = 2 × (0.90 × 0.60) / (0.90 + 0.60) = 2 × 0.54 / 1.50 = 0.72. The F1 score of 0.72 tells us that while the model is good at avoiding false positives (high precision), it is missing many actual positive cases (low recall). This pattern is common in medical diagnosis models that are set to be conservative — they only flag cases they are very sure about.
Q2. An examiner asks: “What is the difference between your Practical File and your Capstone Project?” How do you answer?
Model Answer: The Practical File is a collection of shorter, individual programs that demonstrate specific skills — Python data manipulation, Orange workflows, Computer Vision operations. Each program is a standalone exercise. The Capstone Project is a single, end-to-end project that follows the full Data Science Methodology — from problem definition to model evaluation. The Capstone Project integrates multiple skills from the Practical File and adds documentation, a project report, and a video.
Frequently Asked Questions
Q: Will the examiner ask questions from all 8 units? The viva is based on your Capstone Project and Practical File. Questions will naturally cover the units those involve — primarily Data Science Methodology, Python, Orange, and whichever topic your Capstone Project addresses. Generative AI and Neural Networks questions are common since they are new syllabus additions.
Q: How long is the Class 12 AI viva? Typically 5–10 minutes. The examiner will ask 5–8 questions. They are not trying to trip you up — they are checking that you understand your own work.
Q: What should I bring to the viva? Your Practical File (physical copy), your Capstone Project documentation, and if possible a printed summary of your project with the dataset description and model results. Having your file open and ready shows preparation.
Q: What if my model accuracy was very low? Be honest about it. Explain what you tried, what went wrong, and what you would do differently. An examiner who hears a thoughtful explanation of a 65% accuracy model will often give more marks than an examiner who suspects a student is bluffing about a perfect model they don’t understand.
Q: Can I use my Practical File during the viva? Yes. The viva is specifically based on your Practical File. You are expected to refer to it. Do not memorise page numbers, but know roughly where each program is so you can turn to it quickly when asked.
Action Plan — Before Your Viva
Read through all 40 questions once, then close this page and try to say the answers out loud. For any question you cannot answer from memory, mark it and revise that unit in your notes. Two days before your viva, read through your Practical File completely — every program, every output, every observation. On the day of your viva, arrive five minutes early, have your Practical File and project documentation ready, and remember: the examiner has already seen your work and is asking you to talk about it. That is the easiest kind of question to answer.
Ready to Go Further?
Found this helpful? Share it with your classmates — most students don’t find this page until the night before their viva. The ones who find it two weeks before have a significant advantage.
Viva Prep Pack (full 843 question bank with examiner notes) — coming soon.