Machine learning is one topic that appears in your CBSE AI syllabus across Class 10, 11, and 12 — yet most students treat it as three separate subjects instead of one connected story. This guide puts it all together. Whether you are preparing for your Class 10 boards, Class 11 practicals, or your Class 12 capstone project, you will find exactly what you need right here.
What You Will Learn
- The three types of machine learning and how to tell them apart in any exam question
- What supervised, unsupervised, and reinforcement learning actually mean (with real examples)
- The key algorithms — linear regression, KNN, K-Means, decision trees — explained clearly
- How overfitting and underfitting affect your model, and how to fix them
- How to answer 2-mark and 4-mark ML questions in the CBSE exam
What Is Machine Learning? (And Why Is It Different from AI?)
Artificial Intelligence is the big idea — making machines smart. Machine learning is the method that makes it happen.
Think of it this way: when you were a child, nobody gave you a rulebook to identify dogs. You saw thousands of dogs, made mistakes, got corrected, and eventually your brain learned the pattern on its own. Machine learning works exactly the same way. Instead of a programmer writing every rule, the algorithm learns patterns directly from data.
The textbook definition you should know: Machine Learning is a subset of Artificial Intelligence where systems learn from data, identify patterns, and make decisions with minimal human intervention.
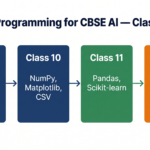
📌 Class 10 Focus: In your CBSE syllabus (Unit 2: Advance Concepts of Modeling in AI), you study the types of ML models and how they differ. Know the three main categories cold.
📌 Class 11 Focus: In Unit 6 — Machine Learning Algorithms, you go deeper into specific algorithms: linear regression, KNN, and K-Means. You also learn how to implement these in Excel and Python.
📌 Class 12 Focus: ML underpins your entire capstone project. You apply the algorithms you learned to build a real solution aligned with a Sustainable Development Goal (SDG).
The Three Types of Machine Learning
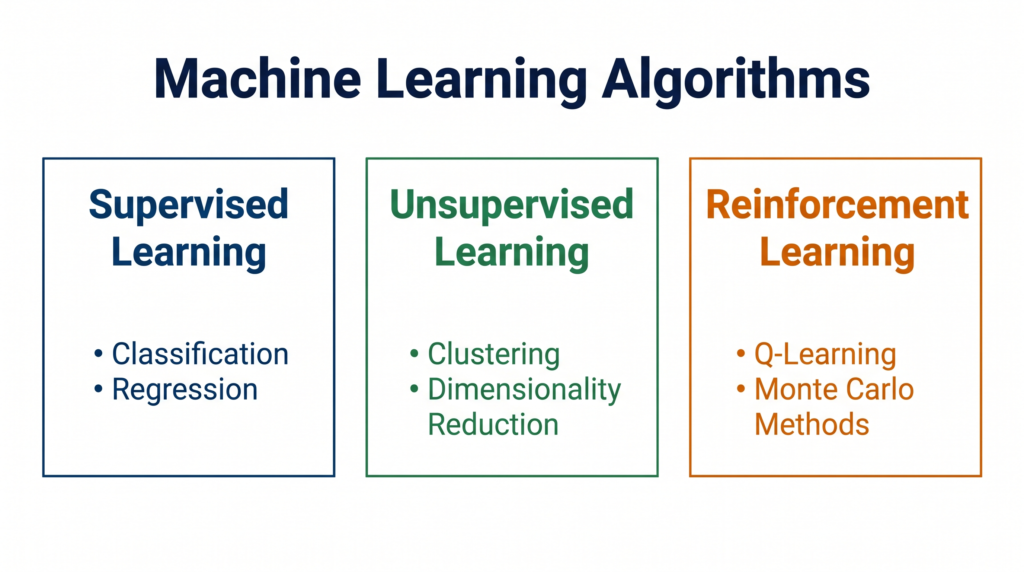
Every machine learning algorithm falls into one of three categories. Understanding this classification is the foundation of every other ML topic in your syllabus.
1. Supervised Learning — Learning with a Teacher
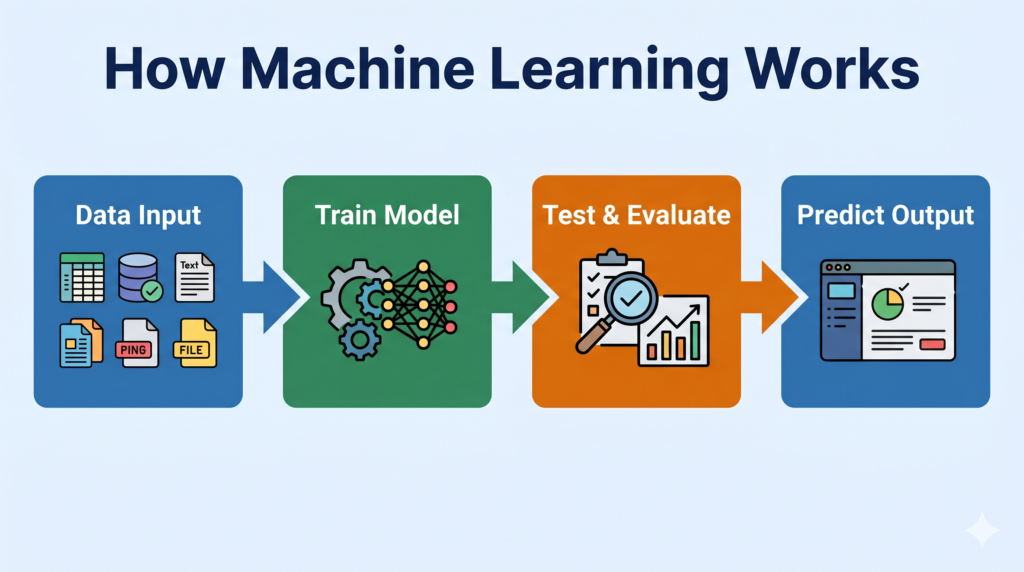
In supervised learning, the algorithm is trained on labelled data — data where the correct answer is already provided. The model learns by comparing its predictions to the known answers and adjusting itself to reduce errors.
Simple analogy: Your teacher gives you 100 solved maths problems. You study the pattern. When the exam gives you an unsolved problem, you apply what you learned. That is supervised learning.
How it works:
- Input: Data with features + correct labels (e.g., 1000 emails marked as “spam” or “not spam”)
- Process: Model learns the relationship between features and labels
- Output: Predicts the label for new, unseen data
Two types of supervised learning tasks:
- Classification — predicts a category (spam/not spam, pass/fail, dog/cat)
- Regression — predicts a number (house price, temperature, marks)
Examples: Email spam filters, CIBIL credit score prediction, Zomato restaurant rating prediction
2. Unsupervised Learning — Finding Hidden Patterns
In unsupervised learning, the algorithm is given unlabelled data — no correct answers are provided. It must find structure and patterns on its own.
Simple analogy: Imagine sorting a pile of mixed clothing. Nobody tells you the categories. You naturally group by type — shirts together, trousers together, socks together. Your brain found the pattern without instructions. That is unsupervised learning.
How it works:
- Input: Data with no labels
- Process: Algorithm groups similar items together (clustering) or finds hidden associations
- Output: Groups, patterns, or compressed representations
Two types of unsupervised learning tasks:
- Clustering — groups similar data points (K-Means clustering is the key algorithm)
- Association — finds items that often appear together (e.g., “customers who bought X also bought Y”)
Examples: Customer segmentation in e-commerce, Aadhaar document fraud pattern detection, grouping patients with similar symptoms in hospitals
3. Reinforcement Learning — Learning by Trial and Error
In reinforcement learning, an agent learns by interacting with an environment. It receives rewards for good actions and penalties for bad ones, and gradually learns the best strategy.
Simple analogy: Think of learning to ride a bicycle. You try, you fall (penalty), you adjust, you balance (reward), you get better. Nobody writes rules for you — you learn through experience.
How it works:
- Agent takes an action in the environment
- Environment gives a reward (positive) or penalty (negative)
- Agent updates its strategy to maximise total rewards over time
Examples: Chess-playing AI (AlphaGo), robots learning to walk, ISRO satellite path optimisation systems, self-driving car steering decisions
📌 Class 10 Exam Note: The CBSE 2025-26 syllabus explicitly asks you to “familiarize with supervised, unsupervised and reinforcement learning based approach.” You need to define all three, give examples, and explain how they differ.
Key Comparison Table — Three Types of Machine Learning
| Feature | Supervised Learning | Unsupervised Learning | Reinforcement Learning |
|---|---|---|---|
| Data type | Labelled | Unlabelled | No fixed dataset — environment-based |
| Goal | Predict output from known patterns | Discover hidden structure | Maximise cumulative reward |
| Human guidance | High (labels provided) | Low (no labels) | Medium (reward system designed by human) |
| Output type | Category (classification) or number (regression) | Groups / clusters / associations | Optimal action policy |
| Key algorithms | Linear Regression, KNN, Decision Trees | K-Means Clustering | Q-Learning (beyond Class 10 scope) |
| CBSE example | Predicting student pass/fail | Grouping customer purchase patterns | Game-playing AI, robots |
| Where in syllabus | Class 10 (Unit 2), Class 11 (Unit 6) | Class 10 (Unit 2), Class 11 (Unit 6) | Class 10 (Unit 2) — conceptual only |
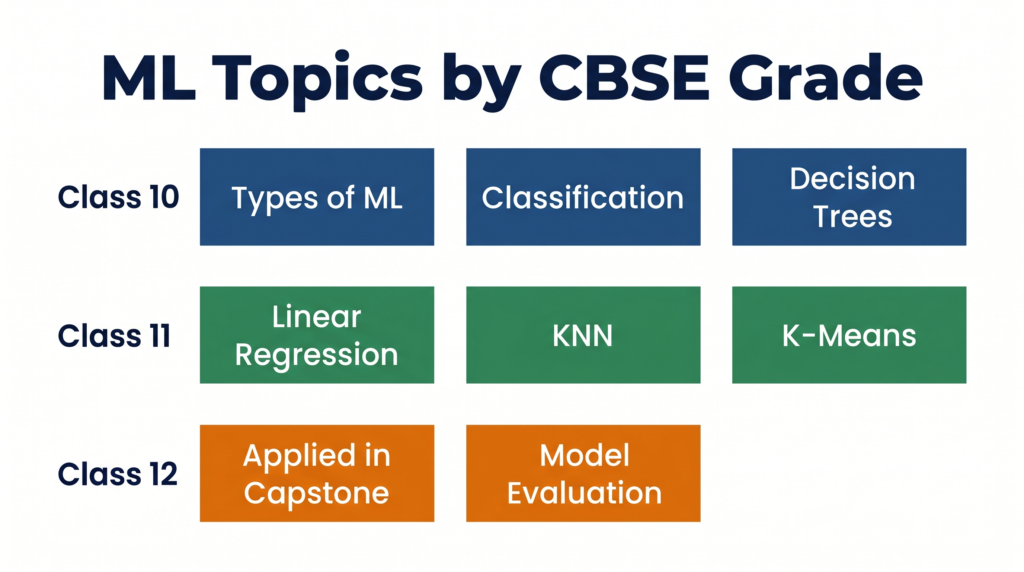
Key ML Algorithms — What Each Grade Studies
Linear Regression (Class 11 — Unit 6)
Linear regression is the simplest and most foundational supervised learning algorithm. It predicts a continuous numerical value by finding the best straight line through a scatter of data points.
What it does: Given two variables (e.g., hours studied and marks scored), linear regression finds the line that best fits all the data points. Once you have this line, you can predict marks for any number of study hours.
The key formula you need:
y = mx + c Where: y = predicted value, x = input feature, m = slope (how steep the line is), c = intercept (where line crosses y-axis)
Pearson Correlation Coefficient (r): Before applying linear regression, you check whether two variables are actually related using the Pearson correlation coefficient. It ranges from -1 to +1:
- r close to +1 → strong positive correlation (as x increases, y increases)
- r close to -1 → strong negative correlation (as x increases, y decreases)
- r close to 0 → no meaningful linear relationship
📌 Class 11 Practical Note: The CBSE 2025-26 syllabus requires you to demonstrate linear regression in both MS-Excel and Python. Python implementation is marked “For Advanced Learners” — it is not mandatory for theory exams but highly recommended for practicals.
India real-world example: VCPL (a manufacturing company) uses linear regression to predict machine maintenance costs based on hours of operation. As machine age increases, maintenance cost follows a predictable upward line — exactly what linear regression models.
K-Nearest Neighbors — KNN (Class 11 — Unit 6)
KNN is a supervised learning algorithm used for classification. It classifies a new data point by looking at the K closest data points already in the dataset and taking a majority vote.
How it works — step by step:
- Choose the value of K (e.g., K=3 means look at 3 nearest neighbors)
- Calculate the distance from the new point to every existing data point
- Pick the K closest points
- The majority class among those K points becomes the prediction
Simple analogy: You move to a new city and want to know which cricket team most people support. You ask your 5 nearest neighbours. 4 say Mumbai Indians, 1 says CSK. You conclude the neighbourhood supports Mumbai Indians. That is KNN — majority vote among nearest neighbors.
Key considerations:
- Small K → model is sensitive to noise (overfitting risk)
- Large K → model is too generalised (underfitting risk)
- Distance is usually calculated using Euclidean distance
📌 Class 11 Exam Note: KNN is classified under “Classification — How it works, Types” in the Class 11 Unit 6 syllabus. Know the step-by-step process and be able to trace through an example manually.
India real-world example: Zomato classifies restaurants into cuisine categories by looking at the characteristics of the nearest similar restaurants already in their database — a KNN-style approach.
K-Means Clustering (Class 11 — Unit 6)
K-Means is an unsupervised learning algorithm that groups data into K clusters based on similarity. Unlike KNN, there are no labels — the algorithm discovers natural groupings on its own.
How it works — step by step:
- Choose K (the number of clusters you want)
- Randomly place K centroids (centre points) in the data
- Assign each data point to the nearest centroid
- Recalculate each centroid as the average of all points in its cluster
- Repeat steps 3–4 until centroids stop moving (convergence)
Simple analogy: Imagine 30 students standing randomly in a school ground. You ask 3 students to stand at random spots (these are your initial centroids). Every other student walks to the nearest of those 3. Then each group’s centroid moves to its actual centre. Repeat until no one needs to move. You now have 3 stable groups — that is K-Means.
Key term: Centroid — the central point of a cluster, calculated as the mean (average) of all data points in that cluster.
📌 Class 11 Practical Note: K-Means clustering demonstration in Python is included in the Class 11 curriculum (marked “For Advanced Learners”). Use Scikit-learn’s KMeans class.
India real-world example: BSNL segments its 300 million customers into groups based on call patterns and data usage using clustering — this allows targeted pricing plans for each segment.
Decision Trees (Class 10 — Unit 2 / Modeling)
A decision tree is a supervised learning algorithm that makes decisions by asking a series of yes/no questions, branching at each step until it reaches a final answer. It looks exactly like an upside-down tree.
How it works:
- Start at the root node — the most important feature (question)
- At each internal node, the data is split based on a condition
- Follow branches (yes/no answers) until you reach a leaf node — the final prediction
Simple example — Should I carry an umbrella?
Is it cloudy?
├── Yes → Is humidity > 70%?
│         ├── Yes → CARRY UMBRELLA ☂️
│         └── No → MAYBE CARRY
└── No → DON'T CARRY ☀️
Key terms:
- Root Node — the topmost question (most important feature)
- Internal Node — intermediate questions/decisions
- Branch — the outcome of a question (yes/no path)
- Leaf Node — the final answer/prediction
📌 Class 10 CBSE Note: The 2025-26 syllabus learning outcome states: “Understand, create and implement the concept of Decision Trees.” You should be able to draw a decision tree for a simple scenario and label its parts correctly.
India real-world example: Banks like SBI use decision tree logic to approve or reject loan applications — “Is income > ₹5 lakh? → Is credit history clean? → Is existing debt low?” — each answer leads to the next branch until approve/reject is reached.
Overfitting and Underfitting — Why Your Model Can Go Wrong
Training a machine learning model is not just about getting it to work on training data. The real challenge is making it work well on new, unseen data.
Underfitting — The Model That Learned Too Little
Underfitting happens when a model is too simple — it has not learned enough from the training data to make accurate predictions, even on the training set itself.
Signs of underfitting:
- High error on training data
- High error on test data
- The model’s line or boundary misses most data points
Cause: Model is too simple, too few features, or trained for too few iterations (epochs).
Fix: Use a more complex model, add more relevant features, train longer.
Analogy: A student who studied only headings and definitions for an essay exam — they know too little to answer any question properly.
Overfitting — The Model That Memorised Instead of Learning
Overfitting happens when a model is too complex — it has memorised the training data including all its noise and random errors, so it performs brilliantly on training data but fails completely on new data.
Signs of overfitting:
- Very low error on training data
- High error on test data (big gap between the two)
Cause: Model is too complex, too many features, trained for too many iterations.
Fix: Use a simpler model, get more training data, use regularisation, or apply train-test split correctly.
Analogy: A student who memorised every question from last year’s paper word-for-word. They score 100 on that paper but fail when the actual exam has different questions.
The Goldilocks Zone — Just Right
| Underfitting | Good Fit | Overfitting | |
|---|---|---|---|
| Model complexity | Too simple | Balanced | Too complex |
| Training error | High | Low | Very low |
| Test error | High | Low | High |
| Problem | Doesn’t learn | — | Memorises noise |
| Solution | More complexity, more features | — | Simpler model, more data, regularisation |
📌 Class 10 & Class 11 Exam Tip: Questions on overfitting/underfitting often appear as 2-mark or 4-mark questions asking you to define the term, identify it from a given scenario, or explain the fix. Always mention both training error and test error in your answer.
See also: Train-Test Split — Complete Tutorial to understand how splitting data helps detect overfitting.
How ML Models Are Evaluated
Building a model is only half the job — you also need to measure how good it is. CBSE Class 10 and Class 12 both cover model evaluation explicitly.
Key evaluation concepts:
- Accuracy — what percentage of predictions are correct overall
- Confusion Matrix — a table showing true positives, true negatives, false positives, false negatives (covered in your Class 10 Unit 3: Evaluating Models)
- Train-Test Split — dividing data into training data (model learns from this) and test data (model is evaluated on this, which it has never seen)
The standard split used in practice is 80% training data and 20% test data, though 70/30 is also common.
For a deeper understanding of how models are measured, read our complete guide: Confusion Matrix & Model Evaluation Metrics
📌 Class 10 Note: Unit 3 of the 2025-26 syllabus is titled “Evaluating Models” — this is a full examinable unit, not just a side topic.
Real-World Applications of Machine Learning
1. Agriculture — Crop Yield Prediction
The Indian Council of Agricultural Research uses ML models trained on soil quality, rainfall patterns, and temperature data to predict which crops will yield best in which region. This is supervised regression — the output is a number (predicted yield in tonnes per hectare).
2. Banking — Fraud Detection
HDFC Bank’s fraud detection system flags suspicious transactions in real time. The model is trained on millions of past transactions labelled “genuine” or “fraud” — classic supervised classification. Any new transaction that looks statistically similar to known fraud patterns triggers an alert.
3. E-Commerce — Customer Segmentation
Flipkart groups its 400+ million customers into segments (bargain hunters, premium buyers, festival shoppers) using K-Means clustering. No labels exist — the algorithm finds natural groupings based on browsing and purchase behaviour. Each segment then gets targeted offers.
4. Manufacturing — Predictive Maintenance
In manufacturing plants, sensors on machines collect vibration, temperature, and pressure data every second. A linear regression model predicts when a machine is likely to fail based on these readings — allowing maintenance before breakdown, not after. This is exactly the kind of problem where AI and industry analytics intersect in the real world.
Common Mistakes Students Make in ML Exams
Mistake 1: Confusing supervised and unsupervised learning Many students write “supervised learning uses data” for both. The key difference is labels. Supervised = labelled data. Unsupervised = unlabelled data. Always mention labels in your definition.
✅ Correct answer: “In supervised learning, the training data includes input features AND the correct output label. The algorithm learns the mapping between inputs and labels.”
Mistake 2: Saying reinforcement learning “uses rewards” without explaining the agent-environment loop Partial definitions lose marks. Always mention: agent, environment, action, reward/penalty.
✅ Correct answer: “In reinforcement learning, an agent takes actions in an environment and receives rewards for correct actions and penalties for incorrect ones. It learns to maximise cumulative reward over time.”
Mistake 3: Mixing up classification and regression Classification predicts categories (yes/no, spam/not spam). Regression predicts numbers (price, temperature, score). The output type is what distinguishes them.
✅ Memory trick: “Regression = Real number. Classification = Category.”
Mistake 4: Describing overfitting as “the model is wrong” Overfitting means the model is too right on training data — it has memorised it. The problem shows up only on new data.
✅ Correct framing: “The model performs very well on training data but poorly on test data — this gap indicates overfitting.”
Exam Strategy
How Marks Are Distributed (Based on CBSE 2025-26 Syllabi)
| Grade | Unit | ML Topic | Exam Weight |
|---|---|---|---|
| Class 10 | Unit 2: Advance Concepts of Modeling in AI | Types of ML, Classification, Regression, Neural Networks | Theory component (check your school’s paper pattern) |
| Class 11 | Unit 6: Machine Learning Algorithms | Linear Regression, KNN, K-Means | Theory + Practical (IBM SkillsBuild: Machine Learning with Python) |
| Class 12 | Applied throughout Capstone | All ML concepts applied in project | Capstone Project = 15 marks, Practical File = 10 marks |
How to Answer a 2-Mark ML Question
Structure: Definition (1 sentence) + Example (1 sentence)
Example question: “What is supervised learning?”
“Supervised learning is a type of machine learning where the model is trained on labelled data — data where correct outputs are already provided. For example, training an email spam detector using thousands of emails already marked as ‘spam’ or ‘not spam’.”
How to Answer a 4-Mark ML Question
Structure: Definition (1 line) + How it works (2–3 lines) + Example (1 line) + Contrast with another type if asked
Example question: “Differentiate between supervised and unsupervised learning with examples.”
Write 2–3 lines on supervised (labelled data, example), then 2–3 lines on unsupervised (unlabelled data, example), then one comparison line about the key difference (labels vs no labels).
Quick Revision Box
| Term | One-Line Definition |
|---|---|
| Machine Learning | A subset of AI where systems learn patterns from data without being explicitly programmed |
| Supervised Learning | ML with labelled training data — model learns to predict known outputs |
| Unsupervised Learning | ML with unlabelled data — model finds hidden patterns or groupings |
| Reinforcement Learning | Agent learns by receiving rewards and penalties from an environment |
| Classification | Supervised task that predicts a category (e.g., spam/not spam) |
| Regression | Supervised task that predicts a continuous number (e.g., price, marks) |
| Clustering | Unsupervised task that groups similar data points (e.g., K-Means) |
| Linear Regression | Algorithm that finds the best-fit line to predict a numerical output |
| KNN | Classifies new data by majority vote of K nearest neighbours |
| K-Means | Groups data into K clusters by iteratively updating centroids |
| Decision Tree | Classification model that makes decisions through a series of yes/no questions |
| Overfitting | Model performs well on training data but poorly on new (test) data |
| Underfitting | Model performs poorly on both training data and test data |
| Centroid | The centre point of a cluster, calculated as the mean of all points in it |
| Labelled Data | Data where the correct output/answer is already provided for each input |
Practice Questions
Question 1 (2 marks): Explain the difference between classification and regression in machine learning with one example each.
Model Answer: Classification is a type of supervised learning that predicts a category or class as output. For example, predicting whether a student will pass or fail based on study hours.
Regression is a type of supervised learning that predicts a continuous numerical value as output. For example, predicting the exact marks a student will score based on study hours.
The key difference: classification output is a label; regression output is a number.
Question 2 (4 marks): Explain the K-Means clustering algorithm with a step-by-step description. How is it different from KNN?
Model Answer:
K-Means Clustering (Unsupervised Learning):
- Choose K (number of clusters)
- Randomly initialise K centroids
- Assign each data point to the nearest centroid
- Recalculate each centroid as the mean of all points in its cluster
- Repeat steps 3–4 until centroids no longer move (convergence)
Key difference from KNN:
| K-Means | KNN | |
|---|---|---|
| Type | Unsupervised | Supervised |
| Data | Unlabelled | Labelled |
| Purpose | Grouping (clustering) | Prediction (classification) |
| K means | Number of clusters | Number of nearest neighbours |
The letter K means something completely different in each algorithm — a common exam trap.
Question 3 (MCQ): Which of the following is an example of unsupervised learning?
(a) Predicting house prices based on area and location (b) Classifying emails as spam or not spam (c) Grouping customers by purchasing behaviour without predefined categories (d) Training a robot to play chess using reward and penalty
Answer: (c)
Explanation: Grouping customers without predefined categories means no labels are provided — the algorithm finds structure on its own. This is the definition of unsupervised learning. Option (a) and (b) are supervised (labelled data), Option (d) is reinforcement learning.
Frequently Asked Questions
Q1. What is the difference between AI, ML, and Deep Learning?
Artificial Intelligence (AI) is the broadest concept — the idea of making machines intelligent. Machine Learning (ML) is a subset of AI where machines learn from data rather than following hand-coded rules. Deep Learning is a subset of ML that uses multi-layered neural networks, capable of handling very complex problems like image recognition and language translation. Think of it as three concentric circles: AI → ML → Deep Learning, each one more specific than the last.
Q2. Is reinforcement learning in the Class 10 exam?
Yes — but only at a conceptual level. The CBSE 2025-26 Class 10 syllabus (Unit 2) requires you to be familiar with the reinforcement learning approach. You need to know its definition, the agent-environment-reward concept, and give an example. You are not expected to implement or code it. Avoid going into Q-learning or other RL algorithms — that is beyond your syllabus.
Q3. What does K stand for in KNN and K-Means — is it the same thing?
No — and this is one of the most common sources of confusion. In KNN (K-Nearest Neighbors), K is the number of neighbours you look at when classifying a new point. In K-Means, K is the number of clusters you want to create. They are completely different meanings. The algorithms are also different: KNN is supervised (uses labels), K-Means is unsupervised (no labels). The shared letter is coincidental — treat them as separate topics.
Q4. Why does a decision tree always start with the most important question?
The root node of a decision tree is chosen based on which feature gives the most useful split — typically measured by a metric called information gain or Gini impurity. The feature that reduces uncertainty the most becomes the root. In practice for CBSE, you do not need to calculate these metrics — but you should know that the root node is always the most important/informative feature for making the prediction. Your exam may ask you to draw or label a decision tree for a simple scenario.
Q5. Which ML skills actually matter for a career in AI in India?
Not in your syllabus but good to know: The most in-demand ML skills in India’s job market (as of 2025-26) are Python with Scikit-learn, understanding of regression and classification algorithms, data preprocessing, and model evaluation. What you are learning in Class 11 — linear regression, KNN, K-Means in Scikit-learn — is directly aligned with what companies like TCS, Infosys, and startups test in fresher-level AI roles. Class 11 ML is not just theory — it is the actual foundation of data science jobs. Every concept in this guide is a real workplace tool.
Action Plan
Exam Practice Checklist
- Write out the definitions of all three ML types from memory (no notes) and check against the Quick Revision Box
- Draw and label a decision tree for a simple scenario of your own (e.g., “Should I study today?”)
- Trace through the K-Means algorithm step-by-step for a dataset of 6 points and K=2 on paper
- Practice the 4-mark differentiation question: Supervised vs Unsupervised (timed, 5 minutes)
- Open the confusion matrix guide and connect overfitting/underfitting to model evaluation metrics
- List 2 real-world Indian examples for each type of ML (make them your own, not from this post)
- Attempt the 3 practice questions above under exam conditions
Interactive Tool — IBM SkillsBuild
The CBSE Class 11 syllabus officially recommends IBM SkillsBuild — Machine Learning with Python as the companion resource for Unit 6. If you are in Class 11, complete the IBM SkillsBuild ML module — it includes interactive exercises on linear regression, KNN, and K-Means that directly complement your practical exam.
Access it at: IBM SkillsBuild
Project Idea — Customer Segmentation Using K-Means
Title: Segment customers of a fictional Indian e-commerce store into 3 groups based on purchase data.
Step 1: Create a small dataset of 20 fictional customers with two features — “number of purchases per month” and “average order value in rupees.”
Step 2: Apply K-Means with K=3 in Python (using Scikit-learn’s KMeans). Plot the clusters using Matplotlib with three different colours.
Step 3: Label your clusters with meaningful business names (e.g., “Frequent Buyers,” “Big Spenders,” “Occasional Shoppers”) and write a 100-word explanation of what the business should do for each group.
This project combines Class 11 K-Means, Python, Matplotlib, and real business thinking — ideal for your practical file or IBM SkillsBuild project.