Your model got 90% accuracy. Great — but if 95% of your data was from one class, a model that predicts that class every single time also gets 95% accuracy. Accuracy alone does not tell the full story. That is why CBSE AI introduces Precision, Recall, and F1 Score — three metrics that give you a much clearer picture of how your model is actually performing.
What You’ll Learn
- What Precision, Recall, and F1 Score measure and why accuracy is not enough
- How to calculate each metric from a confusion matrix using the formula
- When to use each metric — and why it depends on the problem
Why Accuracy Is Not Always Enough
Imagine an AI model that detects fraudulent bank transactions. Out of 1,000 transactions, 990 are genuine and 10 are fraudulent.
A lazy model that says “genuine” for everything scores 99% accuracy — it got 990 out of 1,000 right. But it caught zero fraud cases. This model is useless for the task it was designed for.
This is the problem accuracy hides. When your classes are imbalanced — when one outcome is far more common than the other — accuracy becomes misleading. You need Precision and Recall.
📌 CBSE connection: Class 10 Unit 3 (Evaluating Models) explicitly lists Precision, Recall, and F1 Score as required evaluation techniques. Class 12 Unit 2 lists “Calculate Precision, Recall, F1 score, and Accuracy from the given confusion matrix” as a practical activity.
The Starting Point: Your Confusion Matrix Values
All three metrics are calculated from the four values you learned in the True Positive vs False Positive post:
- TP = True Positives (model said YES, answer was YES)
- FP = False Positives (model said YES, answer was NO)
- TN = True Negatives (model said NO, answer was NO)
- FN = False Negatives (model said NO, answer was YES)
Now let’s build on these.
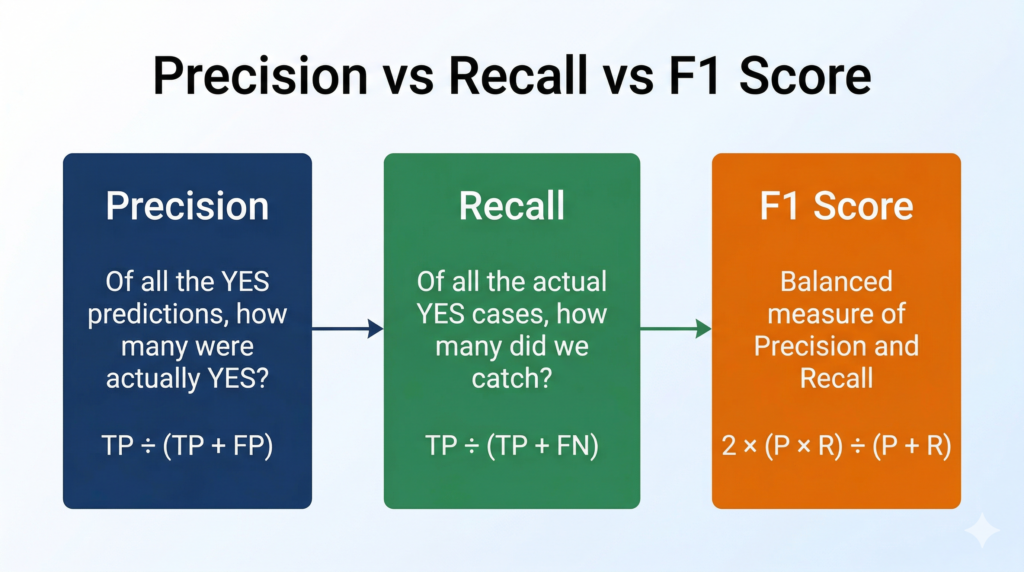
Precision — How Trustworthy Are Your YES Predictions?
Precision answers: “Out of everything the model labelled as positive, how many were actually positive?”Precision=TP+FPTP
In plain English: Precision measures how careful your model is when it says “Yes.” A high-precision model does not cry wolf — when it says something is spam, it almost always is spam.
Worked example:
Your spam detector flagged 50 emails as spam.
- 45 of those emails were genuinely spam (TP = 45)
- 5 were legitimate emails incorrectly flagged (FP = 5)
Precision=45+545=5045=0.90=90%
A precision of 90% means that when your model says “spam,” it is correct 90% of the time. The cost of the 10% error: legitimate emails get blocked.
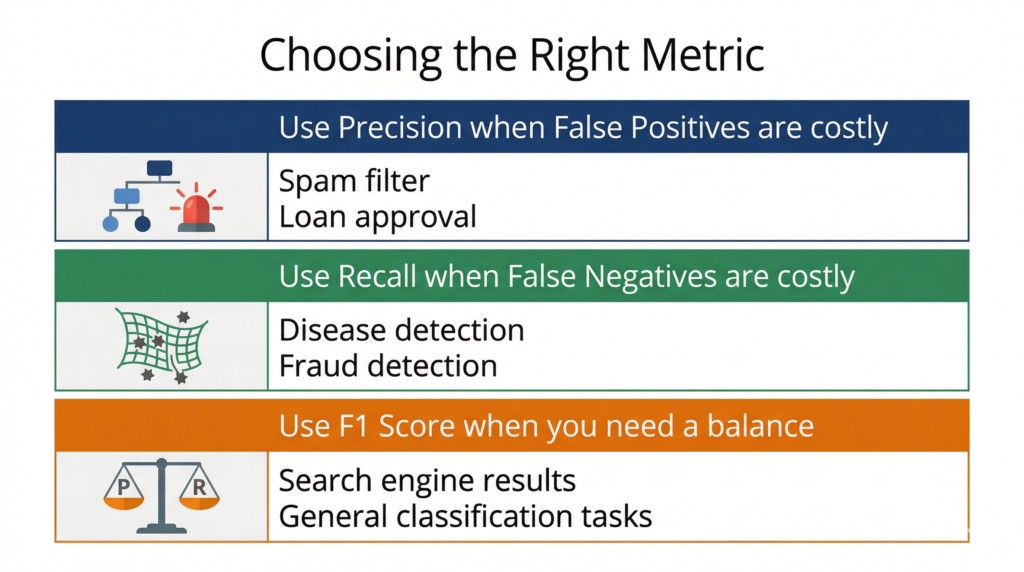
When precision matters most: When a False Positive is costly. In spam filtering, a false positive means a real email goes to spam — annoying but recoverable. In a legal system, wrongly accusing an innocent person is a false positive with very high cost.
Recall — Are You Catching All the Positives?
Recall answers: “Out of all the actual positive cases, how many did the model successfully catch?”Recall=TP+FNTP
Recall is also called Sensitivity or the True Positive Rate. A high-recall model is a thorough net — it catches most of the real positives, even if it occasionally catches some negatives by mistake.
Continuing the same example:
In your full email dataset, there were 60 actual spam emails.
- Your model caught 45 of them (TP = 45)
- It missed 15 spam emails that slipped through (FN = 15)
Recall=45+1545=6045=0.75=75%
A recall of 75% means the model caught 75 out of every 100 actual spam emails. The cost of the 25% miss: some spam reached the inbox.
When recall matters most: When a False Negative is costly. In disease detection, a false negative means a sick patient is sent home without treatment — potentially life-threatening. You want recall as high as possible even if it means a few false alarms.
The Precision-Recall Trade-off
Here is the uncomfortable truth: when you try to increase precision, recall often drops — and vice versa.
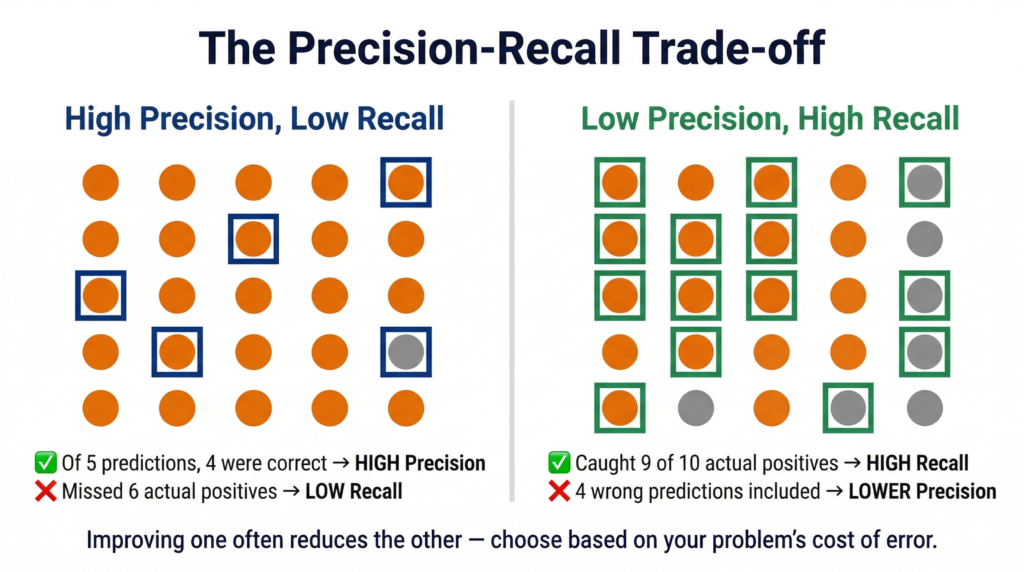
Why? If your model becomes more cautious (only predicting “Yes” when it is very confident), it will have fewer False Positives → higher Precision. But by being more cautious, it will also miss more actual positives → more False Negatives → lower Recall.
Think of a security guard at an airport. A guard who stops every single person for a search will catch every smuggler (high Recall) — but will also stop hundreds of innocent travellers (low Precision). A guard who only stops people matching a very specific profile will stop fewer innocent people (high Precision) — but might miss smugglers who don’t fit the profile (lower Recall).
The right balance depends entirely on what the cost of each error is for your specific problem.
F1 Score — The Balanced Metric
When you need a single number that accounts for both Precision and Recall, you use the F1 Score.
F1 Score=Precision+Recall2×Precision×Recall
This formula is called the harmonic mean of Precision and Recall (not the simple average). The harmonic mean punishes extreme imbalances — if one metric is very low, the F1 Score will be pulled down significantly, even if the other metric is high.
Continuing the example:
- Precision = 0.90
- Recall = 0.75
F1 Score=0.90+0.752×0.90×0.75=1.652×0.675=1.651.35≈0.818=81.8%
An F1 Score of 81.8% tells you the model has a reasonable balance of precision and recall — better than recall alone would suggest, because precision is pulling it up.
When F1 Score is most useful: When neither Precision nor Recall should be sacrificed — for example in search engine results (you want relevant results and you don’t want to miss relevant ones) or general classification benchmarks.
Quick Comparison Table
| Metric | Formula | Answers | Best When |
|---|---|---|---|
| Precision | TP ÷ (TP + FP) | How accurate are the YES predictions? | FP is costly |
| Recall | TP ÷ (TP + FN) | How many actual positives were caught? | FN is costly |
| F1 Score | 2×P×R ÷ (P+R) | What is the balance of P and R? | Both errors matter |
| Accuracy | (TP+TN) ÷ All | Overall correct predictions | Classes are balanced |
Quick Revision Box
| Term | One-Line Definition |
|---|---|
| Precision | Fraction of positive predictions that were actually correct |
| Recall (Sensitivity) | Fraction of actual positives that the model caught |
| F1 Score | Harmonic mean of Precision and Recall |
| Harmonic mean | A type of average that penalises extreme imbalance between two values |
| Precision-Recall trade-off | Increasing precision tends to decrease recall, and vice versa |
Practice Questions
Q1 (2 marks): A disease-detection AI model tested 200 patients. It predicted 40 patients as having the disease. Of these, 30 actually had the disease. In total, 50 patients in the dataset actually had the disease. Calculate the Precision and Recall of this model.
Model Answer:
Given: TP = 30, FP = 10 (model predicted 40 positive, 30 correct → 10 incorrect), FN = 20 (50 actual positives − 30 caught = 20 missed)Precision=30+1030=4030=0.75=75% Recall=30+2030=5030=0.60=60%
The model has higher Precision than Recall — meaning when it predicts disease, it is right 75% of the time, but it misses 40% of actual disease cases.
Q2 (MCQ): In which of the following situations should you prioritise Recall over Precision?
a) A spam filter that blocks emails b) A loan approval system c) A cancer screening test ✅ d) A product recommendation engine
Explanation: In cancer screening, missing a positive case (False Negative) means a patient with cancer is sent home without treatment — a potentially fatal error. Recall must be maximised here. It is acceptable to have some False Positives (patients asked for follow-up tests) as long as no actual cancer case is missed.
FAQ
Q1: Why use the harmonic mean for F1 Score instead of a simple average?
The simple average of Precision and Recall can be misleading when one value is very low. For example, a model with Precision = 1.0 and Recall = 0.01 has a simple average of 0.505 — which sounds almost okay. But the harmonic mean gives an F1 Score of just 0.02, which correctly reflects that the model barely catches any real positives at all. The harmonic mean penalises extreme imbalance, which is exactly what you want from a summary metric.
Q2: My model shows 95% accuracy but the teacher said it is not a good model. Why?
Accuracy can be deceptively high when your dataset is imbalanced — when one class is much more common than the other. For example, if 95% of your data belongs to Class A and 5% to Class B, a model that always predicts Class A will score 95% accuracy but will never detect Class B at all. Always check Precision, Recall, and F1 Score alongside accuracy, especially when your classes are unequal in size.
Q3: Not in your syllabus but good to know — What is the difference between macro and weighted F1 Score?
When your model classifies more than two classes (for example, categorising fruit images as apple, banana, or mango), you calculate Precision and Recall for each class separately, then average them. “Macro F1” treats all classes equally. “Weighted F1” gives more weight to classes with more samples. You will encounter this in scikit-learn’s classification_report in Class 11 and beyond. For CBSE Class 10, the standard binary F1 Score is what you need.