Most Class 11 AI students don’t realise that the practical file carries 10 marks directly, and connects to another 16 marks through the Lab Test (10) and Viva Voce (6). That’s 26 out of 50 practical marks tied to what’s in your file. This guide tells you exactly what to put in it.
Everything here is based on the CBSE AI Class 11 syllabus (Subject Code 843), 2025-26 — specifically Part C: Practical Work requirements.
What You’ll Learn
- The exact marks breakdown for Class 11 AI practicals (with unit-wise detail)
- What CBSE requires in your practical file — mandatory items and unit-wise activities
- All Python programs for Units 3, 5, and 6, with code and expected output
- How to handle non-Python activities (empathy maps, chatbots, ethics tasks)
- What IBM SkillsBuild certification to complete and why it matters
Part C Marks Breakdown — Know What Counts
Before you start writing programs, understand where your 50 practical marks come from.
| Component | Marks |
|---|---|
| IBM SkillsBuild Certification (or any industry certification) | 5 |
| Capstone Project | 12 |
| Bootcamp / Internship / Startup participation | 7 |
| Practical File | 10 |
| Lab Test / Written Exam (based on practical file) | 10 |
| Viva Voce (based on practical file and project) | 6 |
| Total (Part C) | 50 |
📌 Key insight: Your practical file directly earns 10 marks. But since the Lab Test and Viva are also based on your practical file, keeping it thorough and organised means you are preparing for 26 marks at once — more than half your practical score.
What CBSE Mandates in Your Practical File
According to the Class 11 AI syllabus (Subject Code 843, 2025-26), your practical file must contain:
- One certification — IBM SkillsBuild (any course from the syllabus-linked list) or any other industry certification
- At least one activity from each unit (Units 1 through 8)
- One participation certificate — bootcamp, internship, or equivalent
That means your file cannot just be Python programs. It must show work from all eight units. The unit-wise breakdown below shows exactly what to include.
Unit-Wise Practical File Activities
Unit 1: Introduction — Artificial Intelligence for Everyone
Activity: Categorise AI applications into the three domains as given on page 5 of the CBSE AI Student Handbook.
How to present in file: Create a table with three columns — Data AI (structured data), Computer Vision (images/video), Natural Language Processing (text/speech). Fill each column with 4–5 real-world examples (Aadhaar face recognition → Computer Vision; Google Translate → NLP; Zomato order prediction → Data AI).
Unit 2: Unlocking Your Future in AI
Activity A: Identify ten companies currently hiring employees for specific AI positions.
How to present in file: A table with columns — Company Name, AI Job Role, Location, Source (LinkedIn/Naukri). Include Indian companies like TCS, Infosys, Wipro, Flipkart alongside global ones like Google, Microsoft, IBM.
Activity B: Note the technical skills and soft skills listed by any two companies for a specific AI position.
How to present in file: Choose two job postings (e.g., “Machine Learning Engineer” at TCS and Infosys). Create two side-by-side lists — Technical Skills (Python, TensorFlow, SQL) and Soft Skills (communication, problem-solving, teamwork).
Unit 3: Python Programming — Level 1 Programs (5 Programs Minimum)
📌 CBSE requirement: Minimum five programs using operators, data types, and control statements (Level 1 — no libraries).
Program 3.1: Demonstrate Data Types and Operators
python
# Program to demonstrate data types and arithmetic operators

integer_val = 25
float_val   = 3.14
string_val  = "AI"
bool_val    = True

print("Integer:", integer_val)
print("Float  :", float_val)
print("String :", string_val)
print("Boolean:", bool_val)

# Arithmetic operators
a, b = 20, 6
print("\nAddition      :", a + b)
print("Subtraction   :", a - b)
print("Multiplication:", a * b)
print("Division      :", a / b)
print("Floor Division:", a // b)
print("Modulus       :", a % b)
print("Exponent      :", a ** 2)
Expected Output:
Integer: 25
Float  : 3.14
String : AI
Boolean: True

Addition      : 26
Subtraction   : 14
Multiplication: 120
Division      : 3.3333333333333335
Floor Division: 3
Modulus       : 2
Exponent      : 400
Program 3.2: Demonstrate Comparison and Logical Operators
python
# Program to demonstrate comparison and logical operators

x, y = 15, 20

print("x > y  :", x > y)
print("x < y  :", x < y)
print("x == y :", x == y)
print("x != y :", x != y)

# Logical operators
a = True
b = False
print("\nAND:", a and b)
print("OR :", a or b)
print("NOT:", not a)
Expected Output:
x > y  : False
x < y  : True
x == y : False
x != y : True

AND: False
OR : True
NOT: False
Program 3.3: Grade Classification Using if-elif-else
python
# Program to check the grade of a student based on marks

marks = int(input("Enter your marks (out of 100): "))

if marks >= 90:
    print("Grade: A+ — Outstanding")
elif marks >= 75:
    print("Grade: A  — Excellent")
elif marks >= 60:
    print("Grade: B  — Good")
elif marks >= 45:
    print("Grade: C  — Average")
elif marks >= 33:
    print("Grade: D  — Pass")
else:
    print("Grade: F  — Fail")
Expected Output (if user enters 82):
Enter your marks (out of 100): 82
Grade: A  — Excellent
Program 3.4: Print Multiplication Table Using a Loop
python
# Program to print the multiplication table of a given number

number = int(input("Enter a number: "))

print(f"\nMultiplication table of {number}:")
for i in range(1, 11):
    print(f"{number} x {i} = {number * i}")
Expected Output (if user enters 7):
Enter a number: 7

Multiplication table of 7:
7 x 1 = 7
7 x 2 = 14
...
7 x 10 = 70
Program 3.5: Find Factorial Using a While Loop
python
# Program to find the factorial of a number using a while loop

number  = int(input("Enter a positive integer: "))
factorial = 1
n = number

while n > 0:
    factorial = factorial * n
    n = n - 1

print(f"Factorial of {number} is: {factorial}")
Expected Output (if user enters 5):
Enter a positive integer: 5
Factorial of 5 is: 120
Unit 3: Python Programming — Level 2 Programs (5 Programs Minimum)
📌 CBSE requirement: Minimum five programs on NumPy, Pandas, and Scikit-learn.
For the full NumPy tutorial with all array operations and detailed explanations, see our NumPy Tutorial for Class 11 AI Students.
For the complete Pandas guide covering DataFrames, CSV handling, and missing data, see our Pandas Tutorial for Class 11 AI Students.
Program 3.6: NumPy — Array Creation and Operations
python
# Program to demonstrate NumPy array creation and basic operations

import numpy as np

# 1D Array
arr = np.array([10, 20, 30, 40, 50])
print("Array          :", arr)
print("Shape          :", arr.shape)
print("Data Type      :", arr.dtype)
print("Sum            :", np.sum(arr))
print("Mean           :", np.mean(arr))
print("Max            :", np.max(arr))
print("Min            :", np.min(arr))
print("Standard Dev.  :", np.std(arr))

# 2D Array
matrix = np.array([[1, 2, 3], [4, 5, 6], [7, 8, 9]])
print("\n2D Array:\n", matrix)
print("Shape of matrix:", matrix.shape)
Expected Output:
Array          : [10 20 30 40 50]
Shape          : (5,)
Data Type      : int64
Sum            : 150
Mean           : 30.0
Max            : 50
Min            : 10
Standard Dev.  : 14.142135623730951

2D Array:
 [[1 2 3]
  [4 5 6]
  [7 8 9]]
Shape of matrix: (3, 3)
Program 3.7: Pandas — Create DataFrame and Basic Operations
python
# Program to create a Pandas DataFrame and perform basic operations

import pandas as pd

data = {
    "Name"    : ["Arjun", "Priya", "Kiran", "Meena", "Rohan"],
    "Marks"   : [85, 92, 78, 95, 70],
    "Grade"   : ["B", "A", "C", "A", "D"],
    "Attendance": [88, 95, 72, 98, 65]
}

df = pd.DataFrame(data)

print("Full DataFrame:")
print(df)
print("\nFirst 3 rows:")
print(df.head(3))
print("\nDataFrame Info:")
df.info()
print("\nStatistical Summary:")
print(df.describe())
print("\nMean Marks:", df["Marks"].mean())
Expected Output:
Full DataFrame:
    Name  Marks Grade  Attendance
0  Arjun     85     B          88
1  Priya     92     A          95
2  Kiran     78     C          72
3  Meena     95     A          98
4  Rohan     70     D          65

First 3 rows:
    Name  Marks Grade  Attendance
0  Arjun     85     B          88
1  Priya     92     A          95
2  Kiran     78     C          72

Mean Marks: 84.0
Program 3.8: Scikit-learn — Linear Regression
python
# Program to demonstrate Linear Regression using Scikit-learn
# Predict exam marks based on hours of study

from sklearn.linear_model import LinearRegression
import numpy as np

# Training data
hours = np.array([1, 2, 3, 4, 5, 6, 7, 8]).reshape(-1, 1)
marks = np.array([30, 45, 55, 60, 70, 75, 85, 90])

# Create and train the model
model = LinearRegression()
model.fit(hours, marks)

# Predict for 5 hours of study
prediction = model.predict([[5]])
print("Predicted marks for 5 hours of study:", round(prediction[0], 2))
print("Model slope (m)    :", round(model.coef_[0], 2))
print("Model intercept (c):", round(model.intercept_, 2))
Expected Output:
Predicted marks for 5 hours of study: 68.33
Model slope (m)    : 8.57
Model intercept (c): 21.43
Unit 5: Data Literacy — Statistical Programs
📌 CBSE requirement: Programs to demonstrate mean, median, mode, standard deviation, and variance. Programs to visualise line graph, bar graph, histogram, scatter graph, and pie chart using Matplotlib.
Program 5.1: Statistical Measures — Mean, Median, Mode, Std Dev, Variance
python
# Program to demonstrate mean, median, mode, standard deviation and variance

import numpy as np
from scipy import stats

data = [55, 60, 65, 70, 72, 75, 80, 80, 85, 90, 90, 90, 95]

print("Data         :", data)
print("Mean         :", round(np.mean(data), 2))
print("Median       :", np.median(data))
print("Mode         :", stats.mode(data, keepdims=True).mode[0])
print("Std Deviation:", round(np.std(data), 2))
print("Variance     :", round(np.var(data), 2))
Expected Output:
Data         : [55, 60, 65, 70, 72, 75, 80, 80, 85, 90, 90, 90, 95]
Mean         : 77.46
Median       : 80.0
Mode         : 90
Std Deviation: 11.52
Variance     : 132.71
Program 5.2: All Five Chart Types Using Matplotlib
python
# Program to visualise five chart types using Matplotlib

import matplotlib.pyplot as plt
import numpy as np

years  = [2019, 2020, 2021, 2022, 2023]
rainfall = [850, 920, 780, 1010, 870]

# 1. Line Graph
plt.figure(figsize=(8, 5))
plt.plot(years, rainfall, marker='o', color='blue', linewidth=2)
plt.title("Annual Rainfall — Line Graph")
plt.xlabel("Year")
plt.ylabel("Rainfall (mm)")
plt.grid(True)
plt.show()

# 2. Bar Graph
plt.figure(figsize=(8, 5))
plt.bar(years, rainfall, color='green', edgecolor='black', width=0.5)
plt.title("Annual Rainfall — Bar Graph")
plt.xlabel("Year")
plt.ylabel("Rainfall (mm)")
plt.show()

# 3. Histogram
marks_data = [45, 52, 60, 63, 67, 70, 72, 74, 78, 80, 82, 85, 88, 90, 95]
plt.figure(figsize=(8, 5))
plt.hist(marks_data, bins=5, color='orange', edgecolor='black')
plt.title("Marks Distribution — Histogram")
plt.xlabel("Marks Range")
plt.ylabel("Frequency")
plt.show()

# 4. Scatter Graph
study_hours = [1, 2, 3, 4, 5, 6, 7, 8]
exam_marks  = [30, 45, 55, 58, 70, 72, 82, 90]
plt.figure(figsize=(8, 5))
plt.scatter(study_hours, exam_marks, color='red', s=80)
plt.title("Study Hours vs Exam Marks — Scatter Graph")
plt.xlabel("Study Hours")
plt.ylabel("Marks")
plt.show()

# 5. Pie Chart
subjects = ["Math", "Science", "English", "AI", "Hindi"]
marks_pie = [85, 90, 72, 95, 78]
plt.figure(figsize=(7, 7))
plt.pie(marks_pie, labels=subjects, autopct='%1.1f%%',
        colors=['#1A3A6B','#2E8B57','#E8710A','#4A90D9','#F5A623'])
plt.title("Marks Distribution by Subject — Pie Chart")
plt.show()
Expected Output: Five separate chart windows — line, bar, histogram, scatter, and pie — each displaying the respective visualisation.
Unit 6: Machine Learning — Advanced Programs
📌 These are marked For Advanced Learners in the CBSE PDF but are excellent additions to your practical file and commonly asked in Viva.
Program 6.1: K-Nearest Neighbours (KNN) Classification
python
# Program to demonstrate K-Nearest Neighbours classification

from sklearn.neighbors import KNeighborsClassifier
import numpy as np

# Features: [study hours, attendance %]
X = np.array([[2,60],[3,70],[4,75],[6,85],[7,90],[8,95]])
y = ["Fail","Fail","Pass","Pass","Pass","Pass"]

knn = KNeighborsClassifier(n_neighbors=3)
knn.fit(X, y)

# Predict for a new student: 5 hours study, 80% attendance
result = knn.predict([[5, 80]])
print("Predicted result for 5 hrs study, 80% attendance:", result[0])
Expected Output:
Predicted result for 5 hrs study, 80% attendance: PassUnit 4: Capstone Project — Empathy Map and Project Abstract
Activity 4A — Empathy Map
Create an empathy map for a real-world problem. Format for your practical file:
| Quadrant | Content |
|---|---|
| Says | “I don’t know when my crops will fail due to bad weather” |
| Thinks | Worries about income loss and food shortage in the family |
| Does | Checks weather apps manually, talks to other farmers |
| Feels | Anxious about unpredictability, helpless without data |
Problem: Farmers in India lack early warning systems for crop failure due to irregular rainfall. SDG Alignment: SDG 2 — Zero Hunger
Activity 4B — Project Abstract (Design Thinking Framework)
Use the 5W1H method to document your project:
- What: A crop yield prediction system using rainfall data
- Who: Small and marginal farmers in rain-fed agricultural regions
- When: Before the sowing season (Kharif/Rabi)
- Where: Districts with high dependence on monsoon rainfall (e.g., Vidarbha, Bundelkhand)
- Why: To reduce crop loss and help farmers make better planting decisions
- How: Python + Linear Regression model trained on historical IMD rainfall data
Unit 7: Leveraging Linguistics and Computer Science — Chatbot
Activity: Create a chatbot for ordering ice cream using Dialogflow, Botsify, or Botpress.
How to present in file: Take screenshots at each step and paste them with labels:
- Screenshot of the chatbot platform login / new agent creation
- Screenshot of intent creation (e.g., “Order Ice Cream” intent with training phrases)
- Screenshot of entity setup (flavour: chocolate, vanilla, strawberry)
- Screenshot of the test console showing a conversation:
- User: “I want to order an ice cream”
- Bot: “Sure! Which flavour would you like — chocolate, vanilla, or strawberry?”
- User: “Chocolate”
- Bot: “Great! Your chocolate ice cream order has been placed.”
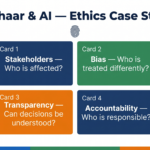
Unit 8: AI Ethics and Values
Activity: Understanding ethical dilemmas using Moral Machine or Survival of the Best Fit.
How to present in file:
- Take 2–3 screenshots of your Moral Machine scenarios
- Write a short paragraph (5–8 sentences) explaining the ethical trade-off in each scenario
- Note the principle at stake: is it utilitarian (greatest good for most people) or rights-based (certain actions are wrong regardless of outcome)?
- For Survival of the Best Fit: write your interpretation of how the simulation connects to algorithmic bias in hiring or lending
IBM SkillsBuild Certification — Which Course to Complete
CBSE directly links IBM SkillsBuild courses to specific units in the Class 11 AI syllabus. Here is the unit-wise mapping:
| Unit | IBM SkillsBuild Course |
|---|---|
| Unit 2 | Your Future in AI: The Job Landscape |
| Unit 3 | Python for Data Science |
| Unit 4 | What is Design Thinking? |
| Unit 5 | Data Visualisation with Python (Modules 1, 2, 3) |
| Unit 6 | Machine Learning with Python |
Recommendation: Complete Python for Data Science (Unit 3) as your primary certification — it is the most directly testable in the Lab Test and Viva. Add Machine Learning with Python (Unit 6) as a second if time permits.
Print the certificate(s), paste the first page in your practical file, and note the completion date and course name.
Practical File Layout — Recommended Order
Organise your file in this sequence for a clean presentation:
- Cover page — Name, Class, Roll No., Subject, Session 2025-26
- Index / Table of Contents
- IBM SkillsBuild Certificate(s) — pasted in
- Bootcamp / Internship participation certificate
- Unit 1 Activity — AI domains categorisation table
- Unit 2 Activities — Company research table + skills analysis
- Unit 3 Programs — Level 1 (5 programs) + Level 2 (5 programs)
- Unit 4 Activities — Empathy map + project abstract
- Unit 5 Programs — Statistical measures + all 5 charts
- Unit 6 Programs — Linear Regression, KNN (advanced)
- Unit 7 Activity — Chatbot screenshots with explanation
- Unit 8 Activity — Ethical dilemma reflection
Quick Revision Box
| Term | Meaning |
|---|---|
np.std() | Standard deviation — spread of data around the mean |
np.var() | Variance — square of standard deviation |
reshape(-1, 1) | Converts a 1D array to a column format required by Scikit-learn |
.fit() | Trains a machine learning model on your data |
.predict() | Uses trained model to make a new prediction |
stats.mode() | Most frequently occurring value in a dataset |
plt.figure(figsize=()) | Sets chart width and height in inches |
autopct | In pie chart — shows percentage label on each slice |
| Empathy map | A tool to understand a user’s perspective — Says, Thinks, Does, Feels |
| 5W1H | Problem-framing method — What, Who, When, Where, Why, How |
Practice Questions
Q1 (2 marks): Write a Python program to find the mean and standard deviation of the list [55, 60, 70, 80, 85, 90] using NumPy.
Model Answer:
python
import numpy as np
data = [55, 60, 70, 80, 85, 90]
print("Mean              :", np.mean(data))
print("Standard Deviation:", round(np.std(data), 2))
Output: Mean: 73.33 Standard Deviation: 12.47
Q2 (MCQ): Which of the following is NOT a mandatory component of the Class 11 AI practical file as per the CBSE 2025-26 syllabus?
a) IBM SkillsBuild certification b) At least one activity from each unit c) A completed Capstone Project video d) Bootcamp or internship participation certificate
Answer: c) A completed Capstone Project video — the video is a Capstone Project requirement, not a practical file requirement. The practical file mandates the certification, unit activities, and participation certificate.
Frequently Asked Questions
Q1: Can I submit fewer than 5 Python programs for Level 1 and Level 2? The CBSE 2025-26 syllabus (Subject Code 843, Unit 3) states “minimum five programs” for Level 1 and “minimum 5 programs” for Level 2. These are the floor, not the ceiling. Submitting more programs (7–8 per level) shows thoroughness and gives your teacher more content to assess for Viva. Never submit fewer than 5 per level.
Q2: My school doesn’t offer bootcamps. What can I substitute for the participation certificate? The syllabus says “bootcamp / internship / other startups.” If your school has not arranged a bootcamp, look for online options — CBSE’s own AI for Youth programme, Microsoft AI for Good, or IBM SkillsBuild learning paths that award participation certificates. Completing an additional IBM SkillsBuild course and printing that certificate is an accepted substitute in many schools — confirm with your teacher.
Q3: Does the chatbot have to be voice-based or text-based? The CBSE syllabus specifies Dialogflow, Botsify, Botpress, or “any other online platform” — all of which support text-based chatbots. A text-based chatbot is fully acceptable. Voice capabilities are not required.