Every year, thousands of Class 12 AI students search for sample papers the week before their exam. The problem is that most of what they find is either from the wrong syllabus year, covers the wrong units, or has no solutions.
This is a full-length practice paper for Class 12 AI (Subject Code 843, Session 2025-26) — structured exactly like the CBSE theory exam, covering all Part B units, with complete model answers.
Use it under timed conditions first. Then check your answers.
What You’ll Learn
- The exact question format and marks distribution for Class 12 AI theory
- How to write answers for 1-mark, 2-mark, and 4-mark questions
- Model answers that show you the level of detail CBSE expects
- Which units carry the highest marks so you can prioritise your revision
Class 12 AI 2025-26 Theory Exam — What to Expect
The Class 12 AI exam is 100 marks total: Theory (50 marks) + Practical (50 marks). The theory paper covers Part A (Employability Skills — 10 marks) and Part B (Subject Specific Skills — 40 marks).
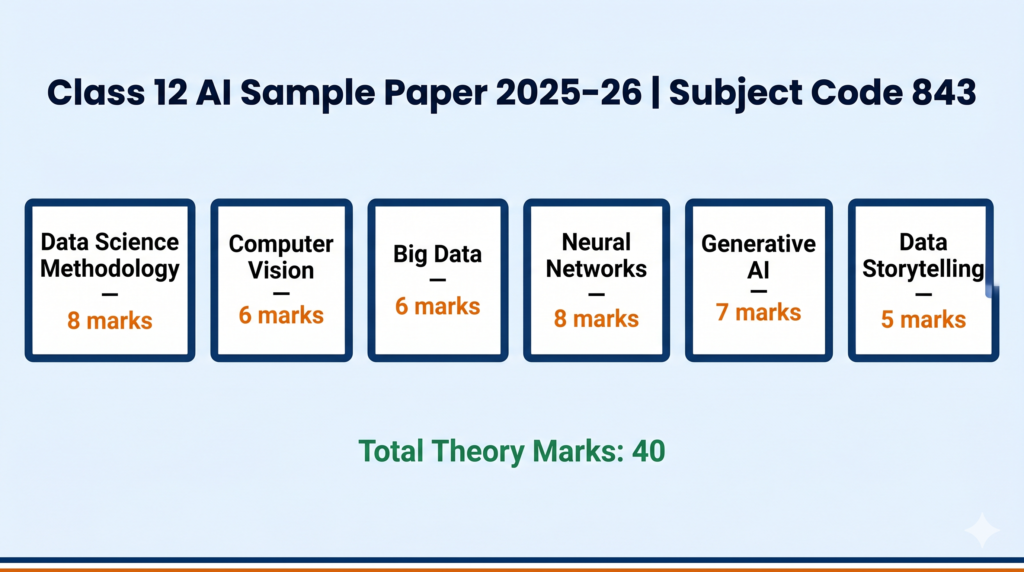
Part B Theory Marks Distribution (based on CBSE 2025-26 curriculum):
| Unit | Topic | Theory Marks |
|---|---|---|
| Unit 2 | Data Science Methodology: An Analytic Approach to Capstone Project | 8 |
| Unit 3 | Making Machines See | 6 |
| Unit 5 | Introduction to Big Data and Data Analytics | 6 |
| Unit 6 | Understanding Neural Networks | 8 |
| Unit 7 | Generative AI | 7 |
| Unit 8 | Data Storytelling | 5 |
| Total | 40 |
Note: Unit 1 (Python Programming II) and Unit 4 (AI with Orange Data Mining Tool) are evaluated in practicals only — they do not appear in the theory paper.
Practice Paper — Class 12 AI (Subject Code 843)
Session 2025-26 | Time Allowed: 2 Hours | Maximum Marks: 50
General Instructions:
- This paper has two sections: Section A (Employability Skills — 10 marks) and Section B (Subject Specific Skills — 40 marks)
- All questions in Section B are compulsory unless an internal choice is provided
- Write answers in the space provided
SECTION A — EMPLOYABILITY SKILLS (10 Marks)
Note: Section A covers Part A Employability Skills units. Questions below are representative of the style and format.
Q1. What is meant by “active listening”? Name two barriers to effective communication. (2 marks)
Q2. Define self-motivation. How is it different from external motivation? (2 marks)
Q3. What is a spreadsheet? Name two functions commonly used in spreadsheet software. (2 marks)
Q4. What do you understand by entrepreneurship? Name two qualities of a successful entrepreneur. (2 marks)
Q5. What is the meaning of “sustainable development”? Give one example related to artificial intelligence. (2 marks)
SECTION B — SUBJECT SPECIFIC SKILLS (40 Marks)
Unit 2: Data Science Methodology (8 Marks)
Q6. Define the term “Data Science Methodology.” List the steps involved in it. (2 marks)
Q7. What is the purpose of train-test split in model building? What is the typical ratio used? (2 marks)
Q8. A student’s model shows 95% accuracy on training data but only 60% accuracy on test data. (4 marks) (a) What problem is the model likely facing? Define it.
(b) Give two reasons why this happens.
(c) Suggest two methods to fix this problem.
Unit 3: Making Machines See (6 Marks)
Q9. What is Computer Vision? Write two real-world applications of Computer Vision. (2 marks)
Q10. List the five stages of the Computer Vision process in the correct order. Give one line explanation of each stage. (4 marks)
OR
Q10. What is meant by image preprocessing? Name any three preprocessing operations and explain why they are performed before analysis. (4 marks)
Unit 5: Introduction to Big Data and Data Analytics (6 Marks)
Q11. What are the 3 Vs of Big Data? Give one example for each V. (3 marks)
Q12. Differentiate between structured and unstructured data. Give two examples of each. (3 marks)
OR
Q12. What is the difference between data analytics and data science? Name one tool used for each. (3 marks)
Unit 6: Understanding Neural Networks (8 Marks)
Q13. Draw and label the basic architecture of an Artificial Neural Network. Name the three types of layers. (3 marks)
Q14. What is overfitting in a neural network? Explain any two methods used to prevent it. (3 marks)
Q15. Differentiate between ANN and CNN. State one application of each. (2 marks)
Unit 7: Generative AI (7 Marks)
Q16. What is Generative AI? How is it different from Discriminative AI? Give one example of each. (3 marks)
Q17. What is a Large Language Model (LLM)? Name any two LLMs and state one application of each. (2 marks)
Q18. “Generative AI raises serious ethical concerns.” Justify this statement with any two ethical issues. (2 marks)
Unit 8: Data Storytelling (5 Marks)
Q19. What are the three components of a Data Story? Explain each briefly. (3 marks)
Q20. What is the difference between a bar chart and a histogram? When would you use each? (2 marks)
MODEL ANSWERS — SECTION B
Unit 2: Data Science Methodology
Q6. Model Answer (2 marks)
Data Science Methodology is a structured, step-by-step approach to solving real-world problems using data. The six steps are: (1) Problem Definition — identifying the exact problem to solve; (2) Data Collection — gathering relevant data from available sources; (3) Data Preparation — cleaning and formatting the data; (4) Model Building — choosing and training an algorithm; (5) Model Evaluation — testing the model’s performance; (6) Deployment — using the model to solve the original problem.
Examiner note: Award 1 mark for a correct definition and 1 mark for correctly listing all six steps. Partial credit: 3–4 correct steps = ½ mark.
Q7. Model Answer (2 marks)
Train-test split divides the dataset into two parts — one portion used to train the model so it can learn patterns, and a separate portion used to test whether the model generalises to new, unseen data. The typical ratio used is 80% for training and 20% for testing. This ensures we can measure how well the model will perform on data it has never seen before, which is a better indicator of real-world performance than training accuracy alone.
Q8. Model Answer (4 marks)
(a) The model is facing overfitting. Overfitting is a condition where the model learns the training data too closely — including its noise and random patterns — and therefore performs poorly when tested on new data it has not seen before.
(b) Two reasons why overfitting happens:
- The model is too complex for the size of the dataset — it has too many parameters relative to the number of training examples.
- The model was trained for too many iterations (epochs), causing it to memorise rather than generalise.
(c) Two methods to fix overfitting:
- Use more training data — a larger, more diverse dataset reduces the chance that the model memorises specific examples.
- Add dropout regularisation — randomly disabling neurons during training prevents any single neuron from becoming over-reliant on specific features.
Examiner note: Other valid answers for prevention include: early stopping, L1/L2 regularisation, reducing model complexity, data augmentation.
Unit 3: Making Machines See
Q9. Model Answer (2 marks)
Computer Vision is a field of AI that enables machines to interpret and understand visual information from images and videos — similar to how human eyes and the brain process visual data. Two real-world applications: (1) Medical imaging — detecting tumours in X-rays and MRI scans; (2) Quality control in manufacturing — automated inspection of products on assembly lines to detect defects.
Q10. Model Answer — Main Question (4 marks)
The five stages of the Computer Vision process, in order:
- Image Acquisition — Capturing the visual input through a camera, scanner, or sensor. This is the raw data collection stage.
- Preprocessing — Cleaning and preparing the image by resizing, converting to grayscale, removing noise, or adjusting brightness. This makes subsequent analysis more reliable.
- Feature Extraction — Identifying meaningful patterns or characteristics in the image such as edges, corners, shapes, or textures that distinguish one object from another.
- Classification or Detection — Using an algorithm (often a CNN) to decide what the image contains or to locate specific objects within the image.
- Output or Action — The system produces a result — a label, a detected object, or an automated action triggered by what the model found.
Examiner note: Award ½ mark per stage for correct name + ½ mark per stage for correct explanation. Full marks require all five stages in the correct sequence.
Q10. Model Answer — OR Option (4 marks)
Image preprocessing is the set of operations applied to a raw image before analysis to improve the quality and consistency of the data. Three preprocessing operations:
- Grayscale conversion — Converting a colour image to grayscale reduces data complexity from three colour channels (RGB) to one, making subsequent processing faster and simpler.
- Resizing — Standardising all images to the same dimensions ensures that the model receives inputs of consistent size, which is required for neural network input layers.
- Noise removal — Applying filters (such as Gaussian blur) to remove random pixel variations caused by poor lighting or sensor errors. Noise can cause feature extraction algorithms to detect false edges or patterns.
Unit 5: Big Data and Data Analytics
Q11. Model Answer (3 marks)
The 3 Vs of Big Data describe its defining characteristics:
- Volume — The enormous quantity of data generated every second. Example: Over 2.5 quintillion bytes of data are generated globally per day, including social media posts, sensor readings, and transaction records.
- Velocity — The speed at which data is generated, collected, and must be processed. Example: A stock market system processes thousands of trades per second and must analyse patterns in real time.
- Variety — The different types and formats of data — structured (databases, spreadsheets), semi-structured (JSON, XML), and unstructured (images, videos, text messages). Example: A hospital stores patient records (structured), doctor’s notes (unstructured), and test reports (semi-structured) simultaneously.
Q12. Model Answer — Main Question (3 marks)
Structured data is organised in a fixed, predefined format with rows and columns, making it easy to search and analyse using standard tools. Examples: student mark sheets in a spreadsheet; bank transaction records in a relational database.
Unstructured data has no fixed format or organisation. It cannot be stored in a standard row-column table and requires specialised tools to process. Examples: WhatsApp messages and voice notes; satellite images of agricultural fields.
Examiner note: Award 1 mark for a correct definition of structured, 1 mark for a correct definition of unstructured, and 1 mark for giving two correct examples of each.
Q12. Model Answer — OR Option (3 marks)
Data Analytics focuses on examining existing datasets to find trends, patterns, and answers to specific questions. It is used to understand what happened and why. A typical tool is Microsoft Power BI or Tableau. Data Science is broader — it involves the entire pipeline from data collection and cleaning through model building and deployment, using statistical and machine learning methods to make predictions. A typical tool is Python with libraries like Scikit-learn and Pandas. In short: data analytics explains the past; data science predicts the future.
Unit 6: Neural Networks
Q13. Model Answer (3 marks)
A basic Artificial Neural Network architecture has three types of layers:
- Input Layer — Receives the raw data. Each node in this layer represents one feature of the input. For example, in a house price prediction model, each input node might represent one variable — area, number of rooms, location.
- Hidden Layer(s) — One or more layers between the input and output that perform mathematical computations. Each neuron in a hidden layer applies weights to its inputs, sums them, and passes the result through an activation function. These layers extract patterns from the data.
- Output Layer — Produces the final result. For a classification task, each output node typically represents one class. For a regression task, there is usually one output node giving a numeric prediction.
[Diagram: Draw three vertical columns of circles connected by arrows — Input Layer → Hidden Layer → Output Layer. Label each layer and the arrows as “weighted connections.”]
Q14. Model Answer (3 marks)
Overfitting in a neural network is a condition where the model performs very well on training data but poorly on new, unseen test data. This happens because the network learns the specific patterns — and the noise — in the training set too precisely, rather than learning general patterns that apply broadly.
Two methods to prevent overfitting:
- Dropout Regularisation — During each training iteration, a random proportion of neurons (typically 20–50%) are temporarily disabled. This forces the network to distribute learning across multiple pathways and prevents any single neuron from over-specialising.
- Early Stopping — Monitor the model’s performance on a validation dataset during training. Stop training when the validation loss stops improving, even if training loss is still decreasing. This prevents the model from training long enough to memorise the training data.
Q15. Model Answer (2 marks)
| ANN | CNN | |
|---|---|---|
| Full Form | Artificial Neural Network | Convolutional Neural Network |
| Design | Fully connected layers — every neuron connects to every neuron in the next layer | Uses convolutional filters that slide over the input to detect local features |
| Best for | Tabular / structured data (e.g. predicting exam scores from study hours) | Image data (e.g. detecting whether a face mask is being worn) |
| Application | Stock price prediction | Facial recognition at DigiYatra airport gates |
Unit 7: Generative AI
Q16. Model Answer (3 marks)
Generative AI is a type of artificial intelligence that creates new content — such as text, images, audio, code, or video — by learning patterns from existing data. It generates outputs that did not exist in its training set.
Discriminative AI classifies or distinguishes between existing categories. It learns the boundary between classes and predicts which category a new input belongs to.
Key Difference: Generative AI produces new data. Discriminative AI categorises existing data.
Example of Generative AI: Google Gemini generating a paragraph of text in response to a student’s question.
Example of Discriminative AI: A spam filter that classifies emails as spam or not spam.
Q17. Model Answer (2 marks)
A Large Language Model (LLM) is a type of Generative AI model trained on massive amounts of text data — billions of words from books, articles, websites, and other sources. It learns statistical patterns in language and can generate coherent, contextually relevant text in response to prompts.
Two LLMs and their applications:
- GPT-4 (used in ChatGPT) — Used for conversational AI, answering questions, writing assistance, and code generation.
- Google Gemini — Used for text generation, image understanding, and building AI chatbots (including the Gemini API practical activity in the Class 12 AI curriculum).
Q18. Model Answer (2 marks)
Generative AI raises serious ethical concerns because:
- Misinformation and Deepfakes — Generative AI can create highly realistic but entirely false content — fake news articles, fabricated images, or video deepfakes of real people. This makes it difficult for individuals to distinguish genuine information from AI-generated fabrications, which can damage reputations and influence public opinion.
- Bias and Fairness — Generative AI models are trained on human-generated data that reflects historical biases — gender stereotypes, racial bias, and cultural assumptions. The models learn and reproduce these biases in their outputs, which can lead to discriminatory results at scale.
Unit 8: Data Storytelling
Q19. Model Answer (3 marks)
A Data Story has three essential components:
- Data — The facts, statistics, and analysis drawn from a dataset. The data forms the evidence base of the story. Without accurate data, the story has no credibility. Example: figures showing the percentage of students who scored above 60% in AI across different states.
- Visualisation — Charts, graphs, maps, or diagrams that make the data visible and easier to understand. Visualisations help the audience see patterns and trends that are difficult to detect in raw numbers. Example: a bar chart showing state-wise AI scores makes regional differences immediately apparent.
- Narrative — The written or spoken explanation that connects the data and visualisations to a meaningful conclusion or recommendation. The narrative tells the audience what the data means and what should be done about it. Example: “States with dedicated AI labs show 23% higher practical scores — a strong argument for infrastructure investment.”
Q20. Model Answer (2 marks)
A bar chart displays data in discrete, separate categories. The bars do not touch each other because the categories are distinct. It is used when comparing values across different groups. Example: comparing the number of students enrolled in AI across Classes 9, 10, 11, and 12.
A histogram displays the distribution of a single continuous numeric variable. The bars touch each other because the data is divided into continuous intervals (bins). It is used to show how data is spread across a range. Example: showing how many students scored in the ranges 0–10, 11–20, 21–30, etc. in an AI exam.
Use a bar chart when comparing categories. Use a histogram when showing the distribution of continuous data.
Exam Strategy for Class 12 AI Theory
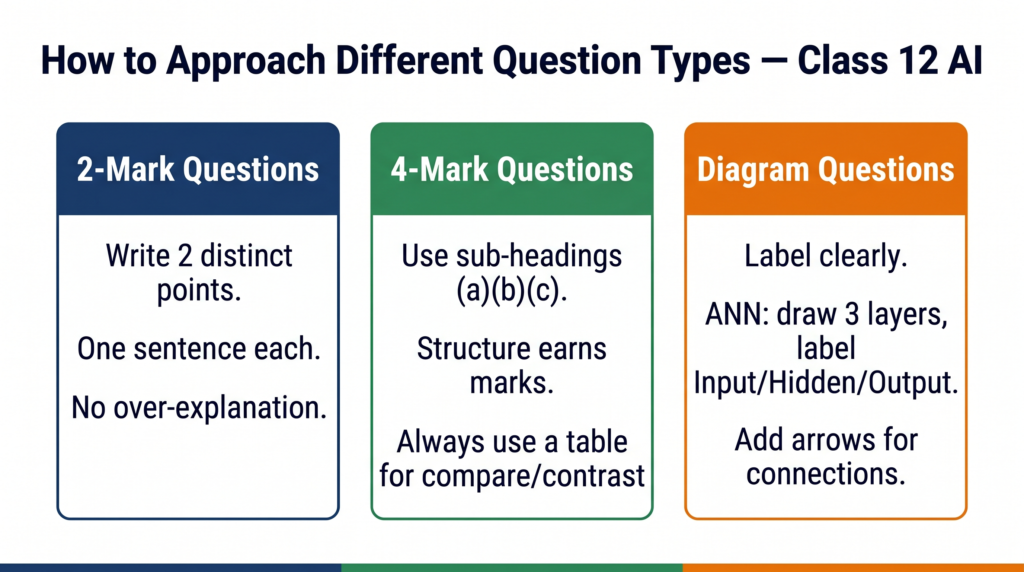
On 2-mark questions: Write two distinct points. One complete sentence per point. Do not over-explain — examiners have 30 seconds per question when marking.
On 4-mark questions: Structure your answer with clear sub-headings (a), (b), (c). CBSE marking schemes allocate marks to specific sub-parts — an answer without structure loses marks even if the content is correct.
On “differentiate” questions: Always use a table. Name both items in the header row, and write two or three rows of clear differences. A table answer scores more consistently than a paragraph answer for comparison questions.
Units to prioritise in the last 48 hours: Neural Networks (8 marks) and Data Science Methodology (8 marks) together account for 40% of Part B. Know the definitions, the architecture diagram, overfitting, and the train-test split concept precisely.
The one thing most students miss: Unit 7 (Generative AI) carries 7 marks and is a 2025-26 addition. Most textbooks do not cover it. Revise the definitions of Generative AI, Discriminative AI, LLMs, prompts, and the two ethical concerns. These questions are almost certain to appear.
Quick Revision Box
Before your theory exam, confirm you can:
☑ State the marks distribution for all 6 theory units without looking
☑ List the 6 steps of the Data Science Methodology in order
☑ Draw and label a basic ANN architecture diagram
☑ Define Generative AI and give one example
☑ Explain the difference between a bar chart and a histogram
☑ Write a 4-mark answer on overfitting with sub-headings (a), (b), (c)
Practice Questions
Q1. A hospital AI system is designed to detect cancer in X-rays. The system has high precision (0.95) but low recall (0.55). (a) Calculate the F1 Score. (b) Is this a good model for this application? Justify your answer in two sentences.
Model Answer: F1 = 2 × (0.95 × 0.55) / (0.95 + 0.55) = 2 × 0.5225 / 1.50 = 0.697. For cancer detection, this model is not acceptable despite high precision. Low recall means the model is missing 45% of actual cancer cases — in a medical context, a false negative (missed cancer) is far more dangerous than a false positive (unnecessary further testing). A model for this application should prioritise recall over precision.
Q2. Explain why Unit 1 (Python Programming II) does not appear in the Class 12 AI theory paper.
Model Answer: According to the CBSE 2025-26 curriculum for Class 12 AI (Subject Code 843), Unit 1 (Python Programming II) is marked with an asterisk (*) indicating it is “to be evaluated in practicals only.” This means the unit is assessed entirely through the Lab Test and Practical File components of Part C, not through the written theory paper. Unit 4 (AI with Orange Data Mining Tool) follows the same rule. Both units require hands-on computer-based demonstration, which is why CBSE chose practical evaluation over written assessment.
Frequently Asked Questions
Q: Is this the official CBSE Class 12 AI sample paper for 2025-26? This is an original practice paper designed in the style and format of the CBSE 2025-26 theory exam, based on the official curriculum document. For the official CBSE sample paper, visit cbse.gov.in. Use both — the official paper shows you the exact format; this paper gives you additional practice questions with detailed model answers.
Q: How many questions will the actual theory paper have? The CBSE theory paper format typically includes a mix of 1-mark (MCQ/VSA), 2-mark (SA), and 4-mark (LA) questions totalling 50 marks including Part A. The exact format may vary slightly between schools and boards. Refer to the CBSE sample paper released on cbse.gov.in for the most accurate current-year format.
Q: Generative AI seems like a small unit — should I study it seriously? Yes. Unit 7 (Generative AI) carries 7 marks in theory — the third-highest unit weightage. It was added to the 2025-26 syllabus and is entirely new. Most students underestimate it because it is not in older textbooks. Students who prepare it thoroughly gain a significant advantage because the competition for those marks is lower.
Q: Can I leave Data Storytelling and still pass? Unit 8 (Data Storytelling) is worth 5 marks. You should not skip it — 5 marks can be the difference between grades. The concepts are straightforward: three components of a data story, types of charts and when to use them, and what makes a visualisation effective. One focused hour of revision is enough to be confident in this unit.
Q: What is the best order to revise for the theory exam? Prioritise by marks weight: Neural Networks (8) → Data Science Methodology (8) → Generative AI (7) → Making Machines See (6) → Big Data (6) → Data Storytelling (5). Spend the most time on units where you are weakest within this priority order.
Your Exam Is Closer Than You Think
Most Class 12 AI students start serious revision two weeks too late. The students who score 45+ in theory are not smarter — they are simply the ones who practised answering questions rather than just reading notes. Set a timer, attempt the paper above without looking at the answers, then score it honestly. The gap between your current score and your target score is exactly the revision gap you need to close.