K-Means is the algorithm that brings unsupervised learning to life. Unlike KNN and linear regression — where the correct answers are already in the training data — K-Means is handed raw, unlabelled data and must discover structure on its own. Understanding how it does that, step by step, is what your Class 11 Unit 6 exam tests. This guide walks you through the complete algorithm, a worked example, the Python implementation, and the one comparison that trips up most students — K-Means vs KNN.
What You Will Learn
- What K-Means clustering is and what problem it solves
- The five-step iterative algorithm — including what convergence means
- What a centroid is and how it moves during training
- How K-Means differs from KNN — the comparison your exam will test
- Python implementation using Scikit-learn (For Advanced Learners)
What Is K-Means Clustering?
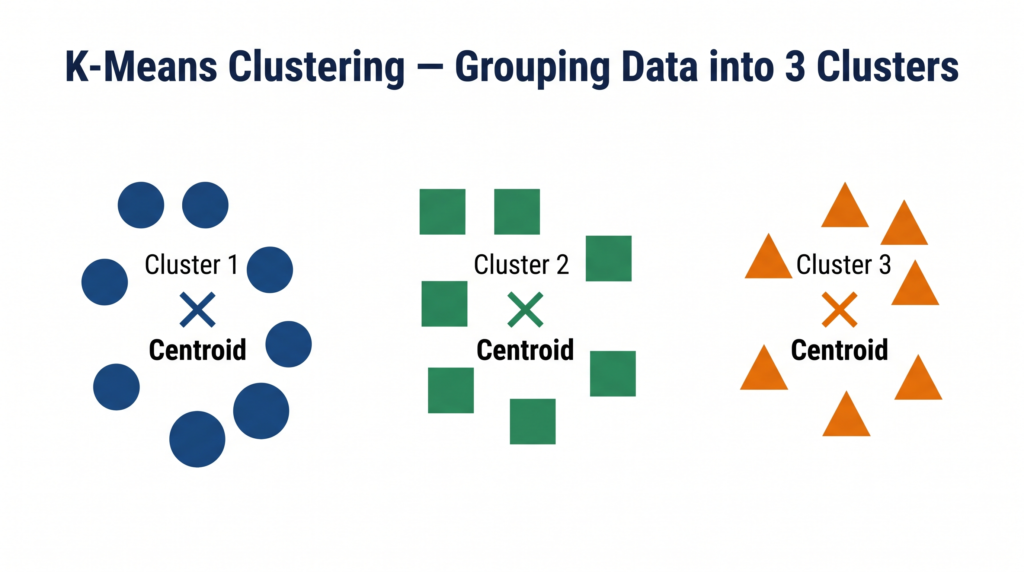
K-Means is an unsupervised machine learning algorithm that groups a dataset into K clusters — where each cluster contains data points that are more similar to each other than to points in other clusters.
“Unsupervised” means no labels are provided — the algorithm receives only input features and must discover the natural groupings entirely on its own.
“K” is the number of clusters you want. You decide this before running the algorithm. K = 3 means the algorithm will find 3 groups. K = 5 means 5 groups.
The central concept is the centroid — the geometric centre of a cluster, calculated as the mean (average) of all data points currently assigned to that cluster. K-Means works by repeatedly moving centroids until they settle in the most stable positions.
📌 Class 11 Syllabus Note: K-Means is covered under Unit 6 — Machine Learning Algorithms: “Unsupervised Learning — Clustering — How it works, Types, k-Means Clustering algorithm.” Python implementation is marked “For Advanced Learners.”
Key Term: What Is a Centroid?
Before walking through the algorithm, you need to understand centroid clearly — it is used in every step.
Definition: A centroid is the central point of a cluster. It is calculated as the mean (average) of all data points currently assigned to that cluster.
Simple example: If Cluster 1 contains three points — (2, 4), (4, 6), and (6, 2) — the centroid is:
- x-coordinate of centroid = (2 + 4 + 6) / 3 = 4
- y-coordinate of centroid = (4 + 6 + 2) / 3 = 4
- Centroid = (4, 4)
The centroid is not necessarily an actual data point in your dataset — it is a calculated average position that represents the “middle” of the cluster.
The K-Means Algorithm — Step by Step
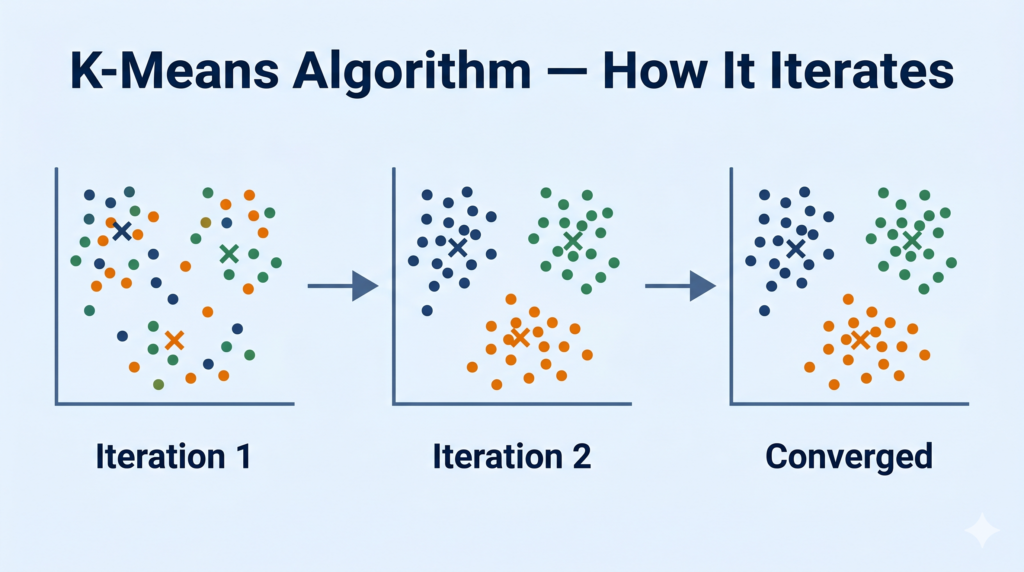
K-Means is an iterative algorithm — it repeats the same two core steps (assign + update) until the clusters stabilise.
Step 1 — Choose K
Decide how many clusters you want. This is your only input to the algorithm beyond the data itself.
Step 2 — Randomly Initialise K Centroids
Place K centroids at random positions in the data space. These are your starting cluster centres — they will not be in their final positions yet. The quality of this random initialisation affects how quickly the algorithm converges (advanced implementations like K-Means++ address this, but for your Class 11 exam, random initialisation is the standard description).
Step 3 — Assign Each Data Point to the Nearest Centroid
Calculate the distance from each data point to every centroid. Assign each point to whichever centroid it is closest to. This forms your K initial clusters.
Distance is measured using Euclidean distance — the same formula you used in KNN:
d = √[(x₂ – x₁)² + (y₂ – y₁)²]
After this step, every data point belongs to exactly one cluster.
Step 4 — Recalculate Centroids
For each cluster, calculate the new centroid — the mean of all data points currently in that cluster. The centroid moves to the average position of its assigned points.
This is the “Means” part of K-Means — the algorithm updates cluster centres by computing means.
Step 5 — Repeat Steps 3 and 4 Until Convergence
Go back to Step 3: reassign data points to the new (updated) centroids. Some points may switch clusters. Then recalculate centroids again. Keep repeating.
Convergence happens when no data point changes its cluster assignment between two consecutive iterations — the centroids have stopped moving. At this point, the algorithm has found stable clusters and terminates.
A Worked Example — Clustering Students by Study Habits
Dataset: 6 students, measured on two features: daily study hours and practice questions attempted per week.
| Student | Study Hours/day (x) | Practice Qs/week (y) |
|---|---|---|
| S1 | 2 | 10 |
| S2 | 3 | 12 |
| S3 | 2 | 8 |
| S4 | 8 | 50 |
| S5 | 9 | 55 |
| S6 | 8 | 48 |
Goal: Find K = 2 clusters (suppose we want to identify “low effort” vs “high effort” students — but we give the algorithm no labels).
Step 1: K = 2
Step 2: Random initialisation — suppose centroids start at:
- C1 = (2, 10) — near S1
- C2 = (8, 50) — near S4
Step 3 — First assignment:
Calculate distances from each student to C1(2,10) and C2(8,50):
- S1(2,10): d(C1) = 0, d(C2) = √[36+1600] ≈ 40.4 → Cluster 1
- S2(3,12): d(C1) = √[1+4] ≈ 2.2, d(C2) ≈ 38.1 → Cluster 1
- S3(2,8): d(C1) = √[0+4] = 2.0, d(C2) ≈ 42.4 → Cluster 1
- S4(8,50): d(C1) ≈ 40.4, d(C2) = 0 → Cluster 2
- S5(9,55): d(C1) ≈ 45.6, d(C2) ≈ 5.1 → Cluster 2
- S6(8,48): d(C1) ≈ 38.1, d(C2) = √[0+4] = 2.0 → Cluster 2
Step 4 — Recalculate centroids:
- New C1 = mean of S1, S2, S3 = ((2+3+2)/3, (10+12+8)/3) = (2.33, 10.0)
- New C2 = mean of S4, S5, S6 = ((8+9+8)/3, (50+55+48)/3) = (8.33, 51.0)
Step 5 — Reassign with new centroids:
Distances barely change — all students remain in their original clusters. No points switch clusters → Convergence reached.
Result:
- Cluster 1 (Low Effort): S1, S2, S3 — study 2–3 hours, attempt ~10 questions/week
- Cluster 2 (High Effort): S4, S5, S6 — study 8–9 hours, attempt ~50 questions/week
Notice: the algorithm was never told these labels. It discovered the two groups purely from the numbers.
KNN vs K-Means — The Comparison You Must Know
This comparison appears in CBSE exams regularly because both algorithms use the letter K and involve distances. They are completely different algorithms.
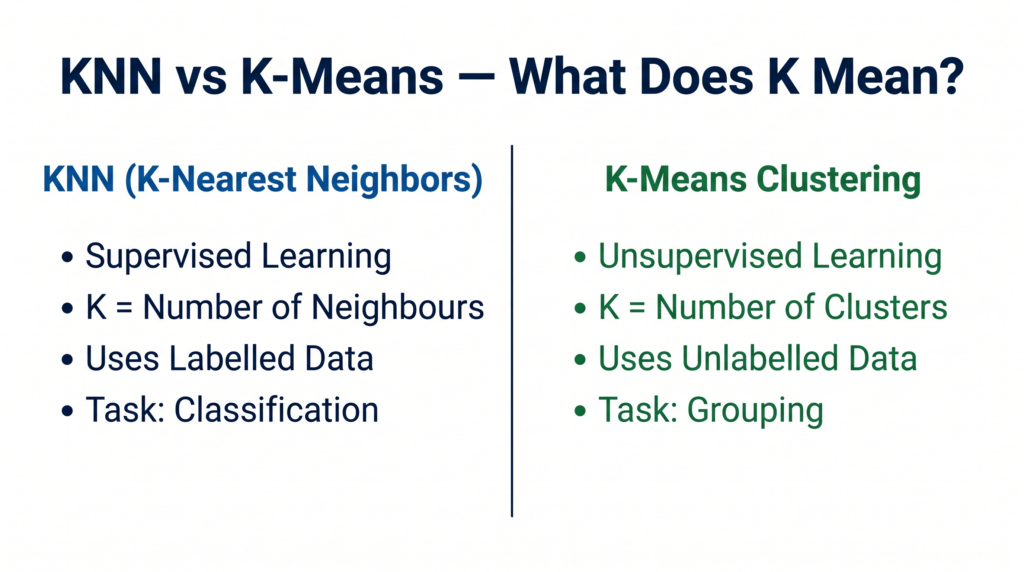
| Feature | KNN (K-Nearest Neighbors) | K-Means Clustering |
|---|---|---|
| Type of ML | Supervised | Unsupervised |
| What K means | Number of neighbours to vote | Number of clusters to form |
| Data required | Labelled (correct answers provided) | Unlabelled (no answers provided) |
| Primary task | Classification | Clustering / Grouping |
| How it uses distance | Finds K nearest labelled points to classify one new point | Assigns all points to nearest centroid repeatedly |
| Training phase | None (lazy learner — stores all data) | Iterative — centroids updated until convergence |
| Output | Class label for one new point | K groups for the entire dataset |
| CBSE algorithm | Unit 6 — Classification | Unit 6 — Unsupervised / Clustering |
The single most important difference for your exam:
In KNN, K = number of neighbours. In K-Means, K = number of clusters. They are not the same thing.
Python Implementation — K-Means with Scikit-learn
⚠️ Note: Python implementation is marked “For Advanced Learners” in the CBSE 2025-26 Class 11 syllabus. Not mandatory for theory — valuable for practicals and IBM SkillsBuild.
python
# Program to demonstrate K-Means Clustering using Scikit-learn
# Dataset: Students grouped by study hours and practice questions

import numpy as np
import matplotlib.pyplot as plt
from sklearn.cluster import KMeans

# Step 1: Prepare the unlabelled dataset
X = np.array([
    [2, 10],   # S1
    [3, 12],   # S2
    [2,  8],   # S3
    [8, 50],   # S4
    [9, 55],   # S5
    [8, 48]    # S6
])

# Step 2: Create and train the K-Means model with K=2
k = 2
model = KMeans(n_clusters=k, random_state=42, n_init=10)
model.fit(X)

# Step 3: View cluster assignments and centroids
print("Cluster labels for each student:", model.labels_)
print("Cluster centroids:", model.cluster_centers_)

# Step 4: Predict cluster for a new student (5 hours, 30 questions)
new_student = np.array([[5, 30]])
cluster = model.predict(new_student)
print(f"New student (5 hrs, 30 Qs) belongs to Cluster: {cluster[0]}")

# Step 5: Visualise the clusters
colors = ['#1A3A6B', '#E8710A']
for i in range(k):
    points = X[model.labels_ == i]
    plt.scatter(points[:, 0], points[:, 1],
                color=colors[i], label=f'Cluster {i+1}', s=100)

# Plot centroids
centroids = model.cluster_centers_
plt.scatter(centroids[:, 0], centroids[:, 1],
            color='#2E8B57', marker='X', s=200, label='Centroids')

plt.xlabel('Study Hours per Day')
plt.ylabel('Practice Questions per Week')
plt.title('K-Means Clustering: Student Study Habits')
plt.legend()
plt.grid(True)
plt.show()
Expected Output:
Cluster labels for each student: [0 0 0 1 1 1]
Cluster centroids: [[ 2.33 10.  ]
                    [ 8.33 51.  ]]
New student (5 hrs, 30 Qs) belongs to Cluster: 0
Key code notes:
KMeans(n_clusters=2)— creates the model with K=2 clustersrandom_state=42— fixes the random initialisation so results are reproducible each runn_init=10— runs K-Means 10 times with different random starts and keeps the best result (avoids poor random initialisation)model.labels_— the cluster number assigned to each training data pointmodel.cluster_centers_— the final centroid coordinates for each clustermodel.predict()— assigns a new data point to the nearest cluster centroid- Labels
[0 0 0 1 1 1]confirm S1, S2, S3 → Cluster 0 and S4, S5, S6 → Cluster 1, matching the worked example
India Real-World Applications
Flipkart — Customer Segmentation: Flipkart’s analytics team uses K-Means to cluster its 400+ million customers into groups based on browsing frequency, average order value, category preferences, and return rates. No one pre-labels customers as “bargain hunters” or “premium buyers” — K-Means discovers these groups. Each cluster then receives targeted promotions and personalised recommendations, directly increasing conversion rates.
Agriculture — Soil Quality Mapping: The National Remote Sensing Centre (NRSC) uses K-Means clustering on satellite imagery data to group agricultural land into zones by soil moisture, temperature, and vegetation index. Farmers in different clusters receive different crop recommendations. No labelled “soil type” data is needed — the clusters emerge from the measurements themselves.
Manufacturing — Defect Pattern Discovery: In an automotive manufacturing plant, quality sensors collect hundreds of measurements from each component produced. K-Means clusters components by measurement similarity. Clusters that consistently contain rejected parts reveal which sensor patterns predict defects — allowing engineers to identify failure modes they had not anticipated. This is unsupervised learning doing exploratory work that labelled data alone could not achieve.
Quick Revision Box
| Term | One-Line Definition |
|---|---|
| K-Means Clustering | Unsupervised ML algorithm that groups data into K clusters by iteratively updating centroids |
| K | The number of clusters — chosen by the user before running the algorithm |
| Centroid | The central point of a cluster — calculated as the mean of all data points in that cluster |
| Cluster | A group of data points that are more similar to each other than to points in other clusters |
| Convergence | The state when centroids stop moving and cluster assignments no longer change between iterations |
| Iteration | One complete cycle of assigning points to centroids and recalculating centroid positions |
| Unsupervised Learning | Machine learning on unlabelled data — the algorithm finds structure without being told the answers |
| n_init | Number of times K-Means reruns with different random starts — the best result is kept |
Practice Questions
Question 1 (2 marks): Explain the role of a centroid in the K-Means clustering algorithm. How does it change during the algorithm?
Model Answer: A centroid is the central point of a cluster in K-Means, calculated as the mean (average position) of all data points currently assigned to that cluster.
During the algorithm, centroids change in two phases: first, each data point is assigned to its nearest centroid; second, each centroid is recalculated as the new mean of its assigned points. This moves the centroid to a more representative position. This two-phase cycle repeats until the centroids stop moving — a state called convergence.
Question 2 (MCQ): In K-Means clustering with K=3, after the first iteration, a data point that was assigned to Cluster 1 is now closer to the centroid of Cluster 2. What happens next?
(a) The algorithm stops — it has found a conflict and cannot continue (b) The data point stays in Cluster 1 — assignments never change after the first iteration (c) The data point is reassigned to Cluster 2 and the centroids are recalculated in the next iteration (d) The value of K is automatically increased to 4 to accommodate the movement
Answer: (c) The data point is reassigned to Cluster 2 and the centroids are recalculated in the next iteration
Explanation: K-Means is iterative — at each step, every data point is reassigned to the nearest centroid based on current centroid positions. Points moving between clusters is exactly how the algorithm improves. This continues until no point changes cluster (convergence). The algorithm does not stop on reassignment — reassignment is the mechanism of learning.
Frequently Asked Questions
Q1. How do you choose the right value of K in K-Means?
Choosing K is one of the most practical challenges in unsupervised learning. The most common technique is the Elbow Method: run K-Means for K = 1, 2, 3, 4, 5… and plot the total within-cluster error (called inertia) for each K. As K increases, inertia decreases. The “elbow” — the point where inertia stops decreasing sharply — suggests the optimal K. For your Class 11 exam, you do not need to calculate the Elbow Method — but knowing it exists and that K is chosen by testing multiple values is a strong addition to a 4-mark answer.
Q2. What is the difference between K in KNN and K in K-Means? Students often confuse these.
This is the most important distinction in your Unit 6 chapter. In KNN, K is the number of neighbours you look at to classify one new data point — it is used at prediction time. In K-Means, K is the number of clusters you want to create across the entire dataset — it is set before the algorithm runs. The algorithms also differ fundamentally: KNN is supervised (uses labels), K-Means is unsupervised (no labels). Same letter, completely different meaning. In an exam, always state both differences — the meaning of K AND supervised vs unsupervised — to earn full marks on a comparison question.
Q3. Can K-Means handle data that does not have clear natural clusters?
Yes — but the results may be meaningless. K-Means will always produce exactly K clusters regardless of whether natural groupings exist in the data. If the data is uniformly distributed with no genuine clusters, K-Means will still draw K arbitrary boundaries. This is a known limitation: the algorithm cannot tell you whether clustering is appropriate for your data or what the “true” number of clusters is. This is why Exploratory Data Analysis — visualising the data first — is done before applying K-Means, to check whether clusters actually appear to exist.