You have trained a regression model that predicts house prices. It predicted ₹45 lakh for a house that actually sold for ₹50 lakh. That is a ₹5 lakh error. But how do you summarise errors like this across hundreds of predictions into one number that tells you how good your model really is? That is exactly what MSE and RMSE do — and calculating them from a given dataset is a listed practical activity in CBSE Class 12 AI Unit 2: Data Science Methodology.
What You’ll Learn
- What MSE and RMSE measure, and why they are used for regression (not classification)
- How to calculate both metrics step by step from a table of values
- How to do the calculation in MS Excel — exactly as CBSE prescribes
Classification Metrics vs Regression Metrics — Know the Difference
Before diving into MSE and RMSE, one important distinction to lock in for your exam:
Precision, Recall, F1 Score, and the Confusion Matrix are used to evaluate classification models — models that predict a category (spam vs not spam, disease vs no disease, cat vs dog).
MSE and RMSE are used to evaluate regression models — models that predict a numerical value (house price, temperature tomorrow, a student’s exam score).
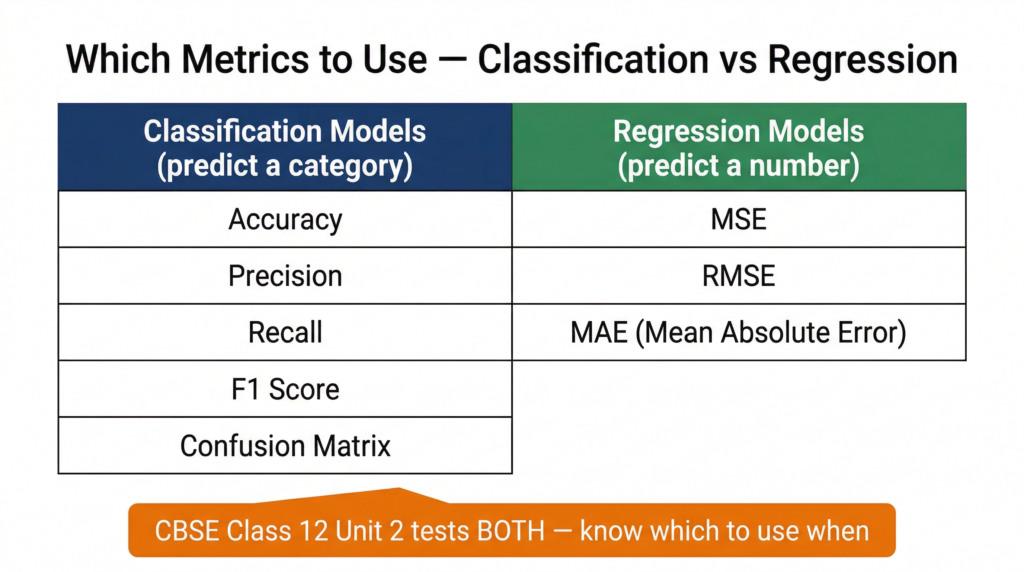
A common exam mistake is applying regression metrics to a classification problem or vice versa. The rule is simple: if your model outputs a number, use MSE/RMSE. If it outputs a category, use precision/recall/F1.
📌 CBSE connection: Class 12 Unit 2 explicitly lists both: “Calculate MSE and RMSE values for the data given using MS Excel” AND “Calculate Precision, Recall, F1 score, and Accuracy from the given confusion matrix.” Both are tested practical activities under Unit 2: Data Science Methodology.
What Is MSE — Mean Squared Error?
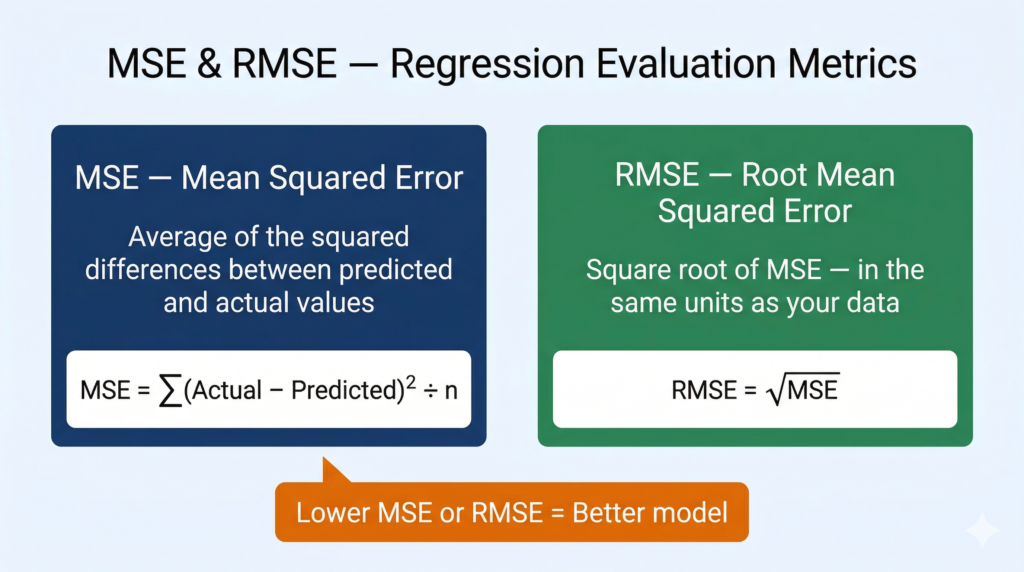
MSE measures the average of the squared differences between what your model predicted and what the actual values were.
Where:
- = the real value for data point i
- = what your model predicted for data point i
- = total number of data points
- = sum across all data points
Why square the errors?
Two reasons. First, without squaring, positive and negative errors cancel each other out — a prediction that is 5 too high and another that is 5 too low would average to zero error, making the model look perfect when it is not. Squaring makes every error positive.
Second, squaring penalises large errors more heavily than small ones. An error of 10 contributes 100 to the MSE, while an error of 2 only contributes 4. This makes MSE sensitive to outliers — models that occasionally make very large mistakes get punished significantly.
Limitation of MSE: Because errors are squared, the unit of MSE is the square of the original unit. If you are predicting house prices in lakhs, your MSE is in lakhs². That is hard to interpret intuitively — which is why we also calculate RMSE.
What Is RMSE — Root Mean Squared Error?
RMSE is simply the square root of MSE.
By taking the square root, RMSE brings the error back into the same unit as the original data. If you are predicting house prices in lakhs, your RMSE is also in lakhs — a number you can directly interpret as “on average, my model’s predictions are off by approximately X lakhs.”
This interpretability is why RMSE is almost always reported alongside or instead of MSE in practice.
Relationship between MSE and RMSE:
A lower RMSE means a better-fitting model. An RMSE of 0 would mean every prediction is perfectly correct — which never happens in real data.
Step-by-Step Calculation — Worked Example
Let’s say a Class 12 student builds a Linear Regression model to predict scores in a class test based on hours studied. Here are 5 data points:
| Student | Actual Score | Predicted Score | Error (A − P) | Error² |
|---|---|---|---|---|
| 1 | 72 | 70 | 2 | 4 |
| 2 | 85 | 89 | −4 | 16 |
| 3 | 60 | 63 | −3 | 9 |
| 4 | 91 | 88 | 3 | 9 |
| 5 | 78 | 75 | 3 | 9 |
| Total | 47 |
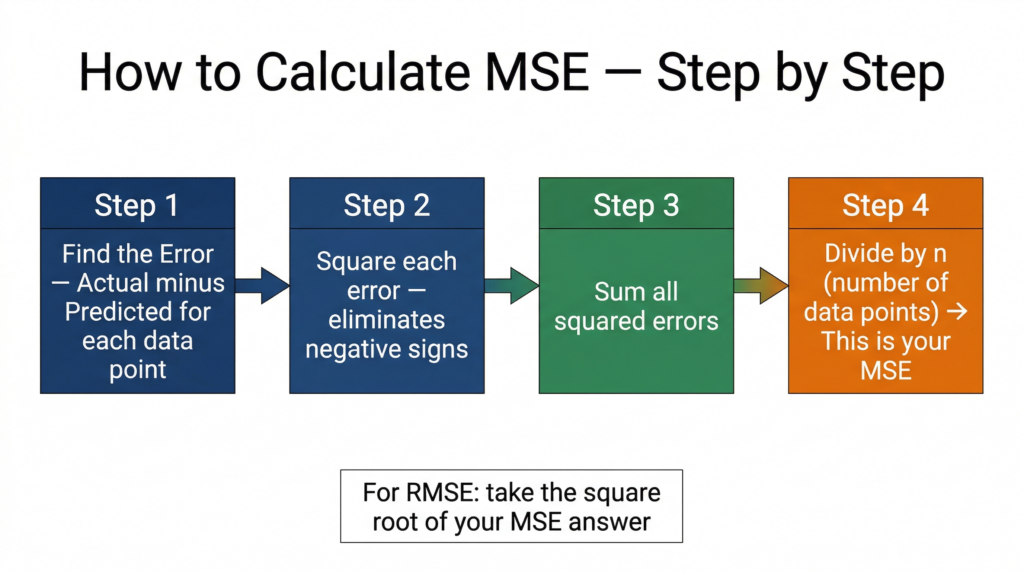
Step 1: Calculate the error for each prediction: Actual − Predicted
Step 2: Square each error (eliminates negatives, penalises large errors)
Step 3: Sum all squared errors: 4 + 16 + 9 + 9 + 9 = 47
Step 4: Divide by n (number of data points):
Step 5: Take the square root for RMSE:
Interpretation: On average, this model’s predictions are off by approximately 3.07 marks from the actual score. Whether that is acceptable depends on the context — for a 100-mark test, ±3 marks is quite reasonable performance.
Calculating MSE and RMSE in MS Excel
CBSE Class 12 Unit 2 specifically prescribes calculating MSE and RMSE using MS Excel. Here is the exact method:
Assume your Actual values are in column B (B2:B6) and Predicted values are in column C (C2:C6).
Column D — Error Squared: In cell D2, type: =(B2-C2)^2 Drag down to D6 to fill the rest.
Cell for MSE: In any empty cell, type: =AVERAGE(D2:D6) This gives you MSE directly — AVERAGE already divides by n.
Alternatively, in one formula: =SUMPRODUCT((B2:B6-C2:C6)^2)/COUNT(B2:B6)
Cell for RMSE: In the cell below MSE: =SQRT(cell_with_MSE) Or in one step: =SQRT(AVERAGE(D2:D6))
What to record in your practical file:
- The full data table with Actual, Predicted, Error, and Error² columns
- The MSE value with its formula shown
- The RMSE value with its formula shown
- A one-line interpretation: “The RMSE of X indicates the model’s predictions deviate from actual values by approximately X [units] on average.”
MSE vs RMSE — Key Differences at a Glance
| Feature | MSE | RMSE |
|---|---|---|
| Full name | Mean Squared Error | Root Mean Squared Error |
| Formula | Σ(A−P)² ÷ n | √MSE |
| Unit | Square of original unit | Same as original unit |
| Interpretability | Harder (squared units) | Easier (same units as data) |
| Sensitivity to outliers | High (both) | High (both) |
| When to prefer | When comparing models mathematically | When communicating error to others |
Quick Revision Box
| Term | One-Line Definition |
|---|---|
| MSE | Average of squared differences between actual and predicted values |
| RMSE | Square root of MSE; error expressed in same units as the data |
| Regression model | A model that predicts a numerical value (not a category) |
| Error | The difference between the actual value and the model’s prediction |
| Lower RMSE | Indicates better model performance (closer predictions to actual values) |
Practice Questions
Q1 (2 marks): A regression model made the following predictions for 4 data points. Actual values: 10, 20, 30, 40. Predicted values: 12, 18, 33, 37. Calculate the MSE and RMSE.
Model Answer:
| Data Point | Actual | Predicted | Error (A−P) | Error² |
|---|---|---|---|---|
| 1 | 10 | 12 | −2 | 4 |
| 2 | 20 | 18 | 2 | 4 |
| 3 | 30 | 33 | −3 | 9 |
| 4 | 40 | 37 | 3 | 9 |
| Total | 26 |
The model’s average prediction error is approximately 2.55 units.
Q2 (MCQ): Which evaluation metric should be used to assess a model that predicts tomorrow’s rainfall in millimetres?
a) Precision
b) F1 Score
c) Confusion Matrix
d) RMSE ✅
Explanation: Predicting rainfall in millimetres is a regression task — the output is a continuous numerical value. RMSE is the appropriate metric because it measures the average prediction error in the same unit as the output (millimetres). Precision, F1 Score, and the Confusion Matrix are classification metrics — they apply only when the model predicts a category.
FAQ
Q1: My MSE is 25 and my RMSE is 5. Does that mean my model has 5% error?
No — RMSE is not a percentage. An RMSE of 5 means the model’s predictions are off by approximately 5 units on average, where “units” matches whatever your output variable is measured in. If you are predicting exam scores out of 100, an RMSE of 5 means ±5 marks average error — which is meaningful only relative to the scale of your output. To get a percentage-style interpretation, some practitioners divide RMSE by the mean of the actual values (this is called NRMSE — Normalised RMSE), but this is beyond your current syllabus.
Q2: Why does squaring the error penalise large mistakes more than small ones? Can you show me with numbers?
Yes — with the same example: a small error of 2 contributes 2² = 4 to the sum. A large error of 10 contributes 10² = 100. So the large error contributes 25 times more to the MSE than the small one, even though it is only 5 times larger. This is what “penalising large errors more heavily” means — and it is why RMSE is sensitive to outliers. If your dataset has a few extreme predictions, your RMSE will be noticeably higher than if those outliers were not there. In manufacturing quality control, this property is useful: you want the model to be severely penalised for large errors, not just mildly penalised.
Q3: Not in your syllabus but good to know — What is MAE (Mean Absolute Error)?
MAE (Mean Absolute Error) is an alternative to MSE that takes the absolute value of errors instead of squaring them:
MAE treats all errors equally (a 10-unit error is exactly 10 times worse than a 1-unit error) and is less sensitive to outliers. In practice, RMSE is preferred when large errors are particularly undesirable; MAE is preferred when all error sizes should be weighted equally. CBSE Class 12 currently tests MSE and RMSE, but you will encounter MAE in college-level ML courses.