Every CBSE AI student reaches the same moment: you open Python for the first time and wonder where to even begin. This guide fixes that — one page, all four grades, exactly what the CBSE syllabus requires you to know.
What You’ll Learn
- What Python topics CBSE expects at each grade level (9, 10, 11, 12)
- How to write, run, and understand Python programs from scratch
- Which libraries matter for which grade — NumPy, Pandas, Matplotlib, Scikit-learn
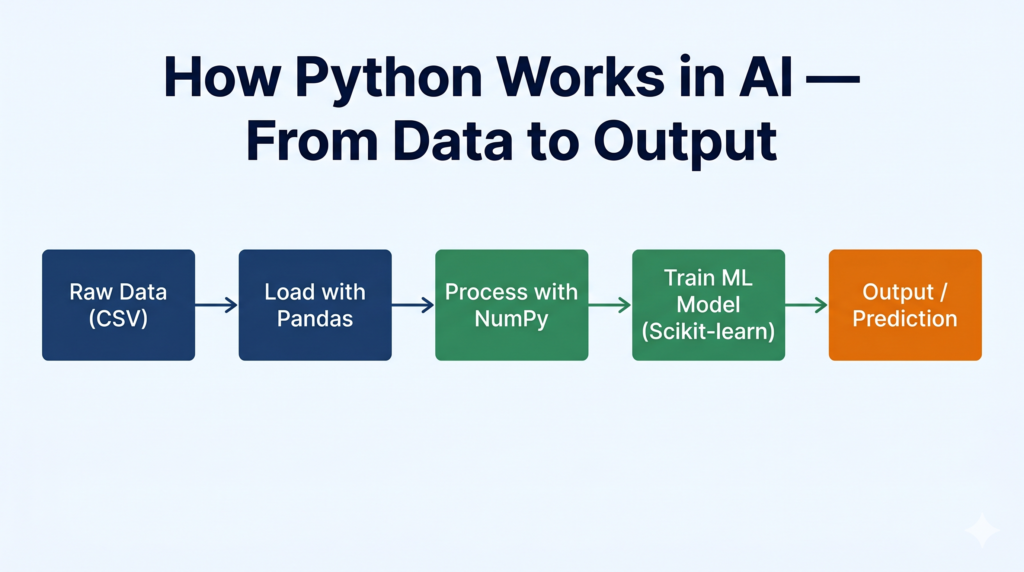
- How Python connects to real AI tasks like data analysis, model training, and evaluation
- Practical programs with code, explanations, and expected output — ready for your practical file

Why Python Is the Language of AI (And Your Syllabus)
Before jumping into grade-wise content, it helps to understand why CBSE chose Python for the AI curriculum.
Python reads almost like English. When you write print("Hello"), you are telling the computer exactly what to do in plain language. That simplicity is not an accident — it is the reason data scientists, machine learning engineers, and AI researchers across companies like Google, ISRO, and Infosys use Python as their primary tool.
In India’s manufacturing sector, Python scripts analyse sensor data from factory floors to predict equipment failures before they happen — a task that would take weeks in older programming languages. The same logic that powers a Class 9 print statement powers a production-grade predictive maintenance system. The only difference is scale.
CBSE has built Python into the AI syllabus progressively: you start with basic output in Class 9 and graduate to working with real datasets, libraries, and machine learning algorithms by Classes 11 and 12. This guide follows that exact progression.
📌 Jump to your grade:
- Class 9 — Python Basics
- Class 10 — Python with Libraries
- Class 11 — NumPy, Pandas & Scikit-learn
- Class 12 — Python for Capstone Projects
(Unit 5: Introduction to Python)
📌 Class 9 students: This section is your complete Python unit. No prior coding experience needed.
What CBSE Expects in Class 9
According to the Class 9 AI syllabus (Subject Code 417, 2025-26), Unit 5 covers:
- Introduction to Python language and its applications
- Variables, Arithmetic Operators, Expressions
- Comparison Operators, Logical Operators, Assignment Operators
- Data Types — integer, float, strings, type conversion
print()andinput()functions- Conditional statements —
if,if-else - Iterative statements —
forloop,whileloop - Python Lists — basic operations
The practical work includes programs using print, input, and list operations. No external libraries are required at this level.
What Is Python? (For Absolute Beginners)
Python is a programming language — a way to give instructions to a computer. Think of it like this: your brain processes the instruction “add 5 and 3” instantly. A computer needs those instructions written in a specific format it understands. Python is that format.
When you type:
python
print(5 + 3)Python reads your instruction, adds 5 and 3, and shows the answer 8 on screen. That’s all programming is at its core — giving clear, step-by-step instructions.
Variables and Data Types
A variable is a name you give to a piece of information so you can use it later.
python
# Variables store information
name = "Arjun"            # string (text)
age = 15                        # integer (whole number)
marks = 87.5               # float (decimal number)
is_passed = True      # boolean (True or False)

print(name)
print(age)
print(marks)
Expected Output:
Arjun
15
87.5
What each line does:
name = "Arjun"— creates a variable callednameand stores the text “Arjun” in itage = 15— stores the number 15marks = 87.5— stores a decimal numberprint(name)— displays the value stored in the variable
Arithmetic Operators
python
a = 20
b = 6

print(a + b)   # Addition → 26
print(a - b)   # Subtraction → 14
print(a * b)   # Multiplication → 120
print(a / b)   # Division → 3.333...
print(a // b)  # Floor Division → 3 (removes decimal)
print(a % b)   # Modulus (remainder) → 2
print(a ** b)  # Exponent (a to the power b) → 64000000
Taking Input from the User
python
# Program to calculate area of a rectangle
length = float(input("Enter length: "))
breadth = float(input("Enter breadth: "))
area = length * breadth
print("Area of rectangle:", area)
Expected Output (if user enters 10 and 5):
Enter length: 10
Enter breadth: 5
Area of rectangle: 50.0
Note: input() always returns text. Use int() or float() to convert it to a number when you need to do calculations.
Conditional Statements (if / if-else)
python
# Program to check if a student passed or failed
marks = int(input("Enter your marks: "))

if marks >= 33:
    print("Congratulations! You have passed.")
else:
    print("You need to score at least 33 to pass.")
The if block runs only when the condition is True. The else block runs when the condition is False. Python uses indentation (the spaces before print) to know which lines belong inside the if block — this is not optional.
Loops — For and While
python
# For loop — runs a fixed number of times
for i in range(1, 6):
    print("Count:", i)
Expected Output:
Count: 1
Count: 2
Count: 3
Count: 4
Count: 5
python
# While loop — runs while a condition is True
number = 1
while number <= 5:
    print("Number:", number)
    number = number + 1
Both loops produce the same result here. Use for when you know exactly how many times to repeat. Use while when you repeat until a condition changes.
Python Lists
A list stores multiple values in a single variable.
python
# Creating and working with a list
students = ["Arjun", "Sonakshi", "Vikram", "Sandhya", "Sonal"]

print(students)                # Print the full list
print(students[0])         # First element → Arjun
print(students[-1])        # Last element → Sonal
print(len(students))      # Length → 5

students.append("Kartik") # Add to end
students.remove("Vikram") # Remove by name

print(students)
Expected Output:
['Arjun', 'Sonakshi', 'Vikram', 'Sandhya', 'Sonal']
Arjun
Sonal
5
['Arjun', 'Sonakshi', 'Sandhya', 'Sonal', 'Kartik']
Class 10 — Python with Libraries (Unit 7: Advance Python)
📌 Class 10 students: Python is assessed through practicals only in your board exam. Focus on understanding programs, not memorising them. Reference: Class 10 AI syllabus (Subject Code 417, 2025-26), Unit 7.
What CBSE Expects in Class 10
Unit 7 (Advance Python) covers:
- Working with Jupyter Notebook, virtual environments, installing Python packages
- Introduction to Python (recap of variables, data types, operators, control structures)
- Python built-in functions and libraries
The suggested practical programs include: list operations, NumPy for mean/median/mode, Matplotlib for line and scatter charts, reading CSV files, and basic image operations with OpenCV.
Setting Up: Jupyter Notebook
Jupyter Notebook is the tool CBSE recommends for Class 10 Python practicals. It lets you write code and see the output in the same window, cell by cell. Think of it like a science lab notebook — you write your experiment (code) and paste the result right below it.
For complete installation steps, read our Jupyter Notebook Setup Guide.
NumPy — Working with Numbers
NumPy (Numerical Python) makes mathematical operations on lists of numbers fast and simple.
python
# Program to calculate mean, median and mode using NumPy
import numpy as np
from scipy import stats

data = [12, 15, 18, 15, 20, 12, 15, 25, 30, 15]

mean = np.mean(data)
median = np.median(data)
mode = stats.mode(data)

print("Mean:", mean)
print("Median:", median)
print("Mode:", mode.mode)
Expected Output:
Mean: 17.7
Median: 15.0
Mode: 15
What each function does:
np.mean()— adds all values and divides by countnp.median()— finds the middle value when sortedstats.mode()— finds the value that appears most often
Matplotlib — Creating Charts
python
# Program to display a line chart
import matplotlib.pyplot as plt

x = [2, 9]
y = [5, 10]

plt.plot(x, y)
plt.title("Line Chart")
plt.xlabel("X values")
plt.ylabel("Y values")
plt.show()
python
# Program to display a scatter chart
import matplotlib.pyplot as plt

x = [2, 9, 8, 5, 6]
y = [5, 10, 3, 7, 18]

plt.scatter(x, y)
plt.title("Scatter Chart")
plt.xlabel("X values")
plt.ylabel("Y values")
plt.show()
Difference between line and scatter:
| Chart Type | When to Use | What It Shows |
|---|---|---|
| Line Chart | Continuous data, trends over time | How values change across a sequence |
| Scatter Chart | Two variables, finding patterns | Whether two variables are related |
Reading CSV Files
CSV (Comma-Separated Values) is the most common format for datasets in AI. Every AI project starts with reading data — this is a non-negotiable skill.
python
# Program to read a CSV file and display 10 rows
import pandas as pd

df = pd.read_csv("data.csv")
print(df.head(10))       # First 10 rows
print(df.info())         # Column names, data types, missing values
For a complete tutorial on reading CSV files with different options and handling missing data, see our Reading CSV Files in Python guide.
Image Operations with Python
python
# Program to read an image and display it
import cv2

img = cv2.imread("photo.jpg")
cv2.imshow("My Image", img)
cv2.waitKey(0)
cv2.destroyAllWindows()
python
# Program to read an image and find its shape
import cv2

img = cv2.imread("photo.jpg")
print("Shape:", img.shape)   # (height, width, channels)
Expected Output (example):
Shape: (480, 640, 3)This means the image is 480 pixels tall, 640 pixels wide, and has 3 colour channels (Red, Green, Blue).
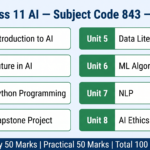
Class 11 — NumPy, Pandas & Scikit-learn (Unit 3: Python Programming)
📌 Class 11 students: Python at this level is a practical tool. Your syllabus (Subject Code 843, 2025-26) requires minimum 5 programs at Level 1 (basics) and minimum 5 programs at Level 2 (NumPy, Pandas, Scikit-learn). Both levels go into your practical file.
What CBSE Expects in Class 11
Unit 3 covers two levels:
Level 1 — Basics of Python Programming:
- Character sets, tokens, modes
- Operators, datatypes, control statements
Level 2 — Libraries:
- CSV Files
- NumPy
- Pandas
- Scikit-learn
Unit 5 (Data Literacy) adds Matplotlib programs: line graph, bar graph, histogram, scatter graph, pie chart using matplotlib.
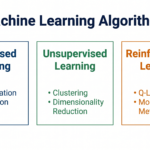
Unit 6 (Machine Learning Algorithms) adds advanced programs for Linear Regression, KNN, and K-Means (marked as For Advanced Learners in the CBSE PDF).
NumPy Deep Dive
NumPy arrays are faster and more memory-efficient than Python lists for numerical operations. This matters when you work with datasets of thousands or millions of values.
python
import numpy as np

# Creating arrays
arr1 = np.array([1, 2, 3, 4, 5])
arr2 = np.array([10, 20, 30, 40, 50])

# Element-wise operations
print(arr1 + arr2)    # [11 22 33 44 55]
print(arr1 * 2)       # [2 4 6 8 10]
print(np.sum(arr1))   # 15
print(np.mean(arr1))  # 3.0
print(np.max(arr1))   # 5
print(np.min(arr1))   # 1

# 2D arrays (like a table)
matrix = np.array([[1, 2, 3], [4, 5, 6], [7, 8, 9]])
print(matrix.shape)   # (3, 3) — 3 rows, 3 columns
print(matrix[1][2])   # 6 — row index 1, column index 2
For a complete Class 11 NumPy tutorial with all practical file programs, see our NumPy Tutorial for Class 11 AI Students.
Pandas Deep Dive
Pandas is built for working with structured data — think of it as Excel, but programmable.
python
import pandas as pd

# Creating a DataFrame from a dictionary
data = {
    "Name": ["Arjun", "Priya", "Kiran", "Meena"],
    "Marks": [85, 92, 78, 95],
    "Grade": ["B", "A", "C", "A"]
}

df = pd.DataFrame(data)

print(df)                    # Full DataFrame
print(df.head(2))            # First 2 rows
print(df.tail(2))            # Last 2 rows
print(df["Marks"].mean())    # Average marks → 87.5
print(df.isnull().sum())     # Count missing values in each column
Expected Output:
    Name  Marks Grade
0  Arjun     85     B
1  Priya     92     A
2  Kiran     78     C
3  Meena     95     A
python
# Reading a CSV and basic analysis
import pandas as pd

df = pd.read_csv("rainfall.csv")   # CBSE uses rainfall.csv in Unit 5
print(df.shape)                    # Rows and columns
print(df.describe())               # Statistical summary
print(df.isnull().sum())           # Missing values per column

# Fill missing values with column mean
df["rainfall"].fillna(df["rainfall"].mean(), inplace=True)
For all Pandas programs required in your practical file, see our Pandas Tutorial for Class 11 AI Students.
Matplotlib — Data Visualisation Programs
Unit 5 of the Class 11 syllabus requires five chart types. Here they are, clean and ready for your practical file:
python
import matplotlib.pyplot as plt
import numpy as np

x = [2014, 2015, 2016, 2017, 2018]
y = [120, 135, 110, 150, 140]

# 1. Line Graph
plt.plot(x, y, color="blue", marker="o")
plt.title("Annual Rainfall (mm)")
plt.xlabel("Year")
plt.ylabel("Rainfall")
plt.show()

# 2. Bar Graph
plt.bar(x, y, color="green")
plt.title("Annual Rainfall Bar Chart")
plt.xlabel("Year")
plt.ylabel("Rainfall")
plt.show()

# 3. Histogram
data = [55, 60, 65, 70, 72, 75, 80, 85, 88, 90, 92, 95]
plt.hist(data, bins=4, color="orange", edgecolor="black")
plt.title("Marks Distribution")
plt.xlabel("Marks Range")
plt.ylabel("Number of Students")
plt.show()

# 4. Scatter Graph
x2 = [1, 2, 3, 4, 5, 6, 7, 8]
y2 = [3, 5, 4, 8, 6, 9, 7, 10]
plt.scatter(x2, y2, color="red")
plt.title("Study Hours vs Marks")
plt.xlabel("Study Hours")
plt.ylabel("Marks")
plt.show()

# 5. Pie Chart
subjects = ["Math", "Science", "English", "AI", "Hindi"]
marks = [85, 90, 78, 95, 82]
plt.pie(marks, labels=subjects, autopct="%1.1f%%")
plt.title("Marks by Subject")
plt.show()
Scikit-learn — Your First Machine Learning Programs
Scikit-learn is the go-to library for machine learning in Python. At Class 11 level, you will use it for Linear Regression, KNN, and K-Means.
python
# Linear Regression — predict marks from study hours
from sklearn.linear_model import LinearRegression
import numpy as np

# Training data
hours = np.array([1, 2, 3, 4, 5, 6, 7, 8]).reshape(-1, 1)
marks = np.array([30, 45, 55, 60, 70, 75, 85, 90])

# Create and train the model
model = LinearRegression()
model.fit(hours, marks)

# Predict for 5 hours of study
prediction = model.predict([[5]])
print("Predicted marks for 5 hours:", round(prediction[0], 2))

print("Slope (m):", round(model.coef_[0], 2))
print("Intercept (c):", round(model.intercept_, 2))
Expected Output:
Predicted marks for 5 hours: 68.33
Slope (m): 8.57
Intercept (c): 21.43
For the connection between Linear Regression code and theory, see our Linear Regression Algorithm Explained guide.
python
# K-Nearest Neighbours — classify a new point
from sklearn.neighbors import KNeighborsClassifier
import numpy as np

X = np.array([[1,2],[2,3],[3,1],[6,5],[7,8],[8,6]])
y = ["A","A","A","B","B","B"]   # Labels

knn = KNeighborsClassifier(n_neighbors=3)
knn.fit(X, y)

result = knn.predict([[5, 5]])
print("Predicted class:", result[0])
For detailed explanation of how KNN works, see our K-Nearest Neighbors (KNN) Algorithm Tutorial.
Class 12 — Python for Capstone Projects (Unit 1: Python Programming – II)
📌 Class 12 students: Unit 1 (Python Programming – II) is assessed in practicals only, not theory. Reference: Class 12 AI syllabus (Subject Code 843, 2025-26). The unit is a recap and application — it assumes you already know NumPy and Pandas from Class 11.
What CBSE Expects in Class 12
Unit 1 covers:
- Recap of NumPy library
- Recap of Pandas Library
- Importing and Exporting Data between CSV files and DataFrames
- Handling missing values
- Linear Regression algorithm (For Advanced Learners)
The practical focus is on importing/exporting data between CSV files and Pandas DataFrames, and implementing Linear Regression (advanced).
Importing and Exporting CSV Data
python
import pandas as pd

# Import: Read CSV into DataFrame
df = pd.read_csv("student_data.csv")
print(df.head())

# Handle missing values
print(df.isnull().sum())              # Check which columns have missing values

df["age"].fillna(df["age"].mean(), inplace=True)       # Fill numeric with mean
df["city"].fillna("Unknown", inplace=True)             # Fill text with placeholder
df.dropna(subset=["marks"], inplace=True)              # Drop rows where marks is missing

# Export: Save cleaned DataFrame back to CSV
df.to_csv("student_data_cleaned.csv", index=False)
print("File saved successfully.")
What index=False does: Without it, Pandas adds an extra column of row numbers (0, 1, 2…) to your CSV. index=False keeps the file clean.
Evaluating a Machine Learning Model
python
# Python Code to Evaluate a Model
from sklearn.linear_model import LinearRegression
from sklearn.model_selection import train_test_split
from sklearn.metrics import mean_squared_error, r2_score
import numpy as np

# Sample data: hours studied vs exam marks
X = np.array([1,2,3,4,5,6,7,8,9,10]).reshape(-1,1)
y = np.array([30,40,50,55,65,70,75,82,88,95])

# Split into training and testing sets
X_train, X_test, y_train, y_test = train_test_split(X, y, test_size=0.2, random_state=42)

# Train model
model = LinearRegression()
model.fit(X_train, y_train)

# Predict and evaluate
y_pred = model.predict(X_test)
mse = mean_squared_error(y_test, y_pred)
r2 = r2_score(y_test, y_pred)

print("MSE:", round(mse, 2))
print("R² Score:", round(r2, 4))
For understanding MSE and R² in depth, see our MSE & RMSE Evaluation Metrics Tutorial and Model Validation Techniques Explained.
For understanding train-test split logic, see our Train-Test Split Complete Tutorial.
Taking It Further — Python in Your Capstone Project
This section goes beyond your exam syllabus. Use it for your Capstone Project.
In a real manufacturing environment, Python does exactly what you practise in school — but with live data. At VCPL (a manufacturing company), production line sensors generate temperature, vibration, and pressure readings every few seconds. A Python script reads this as a CSV, cleans the missing sensor values, trains a regression model on historical data, and flags when a reading suggests equipment is about to fail.
The code structure looks almost identical to what you wrote above. The only differences are the data source (a database or API instead of a local CSV), the volume (millions of rows), and the output (a dashboard alert instead of a print() statement).
For your Capstone Project, here is a simple application of the same skills:
python
# Mini Capstone: Predict crop yield from rainfall data
import pandas as pd
from sklearn.linear_model import LinearRegression
from sklearn.model_selection import train_test_split
import numpy as np

# Step 1: Create sample dataset (in real project, load from CSV)
data = {
    "rainfall_mm": [400, 550, 600, 480, 700, 750, 430, 620, 580, 660],
    "yield_tonnes": [2.1, 3.0, 3.4, 2.5, 4.0, 4.3, 2.3, 3.6, 3.2, 3.8]
}
df = pd.DataFrame(data)

# Step 2: Prepare features and target
X = df[["rainfall_mm"]]
y = df["yield_tonnes"]

# Step 3: Train-test split
X_train, X_test, y_train, y_test = train_test_split(X, y, test_size=0.2, random_state=0)

# Step 4: Train model
model = LinearRegression()
model.fit(X_train, y_train)

# Step 5: Predict
rainfall_input = np.array([[530]])
predicted_yield = model.predict(rainfall_input)
print(f"Predicted crop yield for 530mm rainfall: {predicted_yield[0]:.2f} tonnes")
This is the kind of project that directly maps to India’s agricultural challenges — predicting yield from rainfall is a real use case being explored by organisations like ICAR (Indian Council of Agricultural Research) using the same Python stack you now know.
Python Across the Grades — Quick Comparison
| Feature | Class 9 | Class 10 | Class 11 | Class 12 |
|---|---|---|---|---|
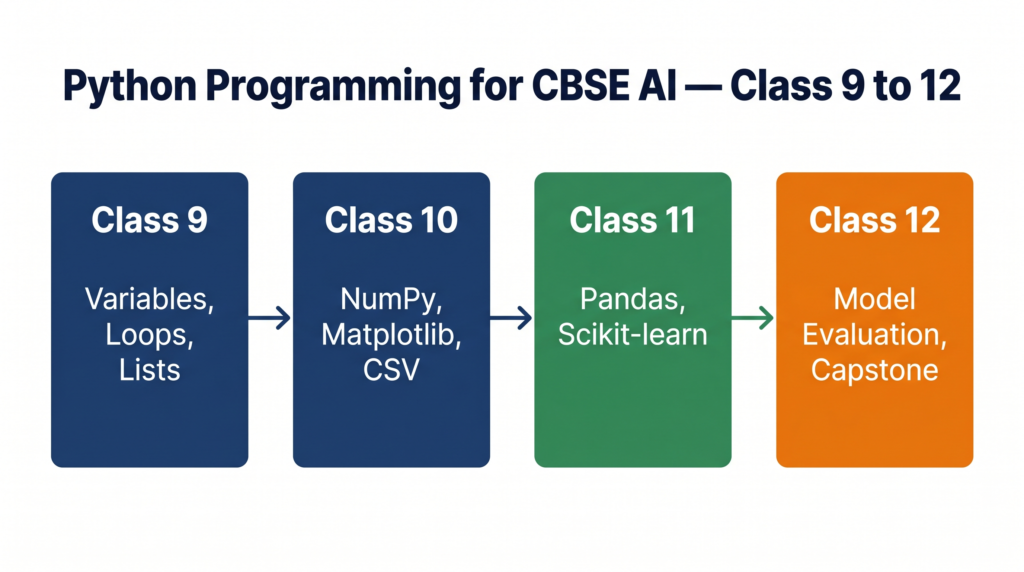
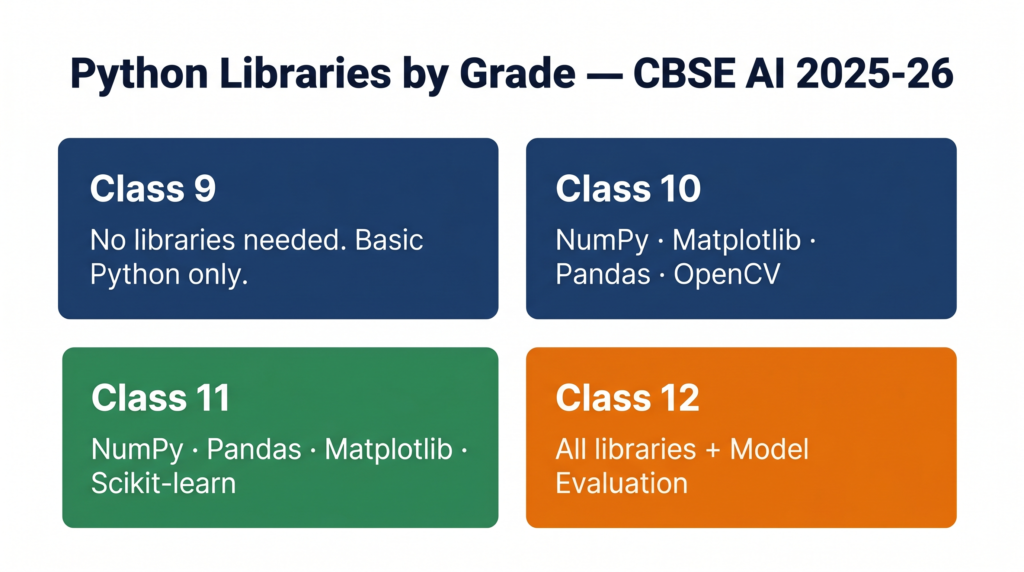
| Libraries | None | NumPy, Matplotlib, Pandas, OpenCV | NumPy, Pandas, Matplotlib, Scikit-learn | All above |
| Programs in Practical File | As per CBSE sample list | As per suggested programs list | Min 5 (Level 1) + Min 5 (Level 2) | CSV import/export + model evaluation |
| Code complexity | Basic | Moderate | Intermediate | Applied/project |
| Assessment | Internal/practical | Practicals only | Practical file + certifications | Practicals only |
| Key skill | Print, input, loops, lists | Charts, CSV reading, images | Data analysis, ML basics | Model evaluation, Capstone |
Common Mistakes Students Make
Mistake 1: Forgetting indentation Python uses spaces (not brackets) to define code blocks. Every line inside an if, for, or while must be indented by exactly 4 spaces or 1 tab — inconsistent indentation causes IndentationError.
Wrong:
python
if marks > 33:
print("Passed")   # No indent — this will crash
Correct:
python
if marks > 33:
    print("Passed")   # 4 spaces indent — this works
Mistake 2: Using input() without type conversion input() always returns a string. If you type 15, Python stores "15" (text), not 15 (number). Trying to do arithmetic on it gives a TypeError.
Wrong: marks = input("Enter marks: ") Correct: marks = int(input("Enter marks: "))
Mistake 3: Zero-based indexing confusion In Python, list positions start at 0. students[0] is the first student, students[1] is the second. Students frequently write students[1] when they want the first item — especially under exam pressure.
Mistake 4: Confusing = and == = assigns a value. == checks if two values are equal. marks = 50 stores 50 in marks. marks == 50 asks “is marks equal to 50?” and returns True or False.
Mistake 5: Not importing libraries before use You cannot use np.mean() without first writing import numpy as np. Missing import lines are the most common reason practical programs fail to run.
Exam Strategy
How Python Appears in Your Exam
| Grade | Theory Marks | Practical Marks | Python in Exam |
|---|---|---|---|
| Class 9 | — | Internal assessment | Practical file programs |
| Class 10 | 0 (Unit 7 is practicals only) | 20 marks practicals | Programs from suggested list |
| Class 11 | Unit 3 theory | Practical file | Level 1 + Level 2 programs |
| Class 12 | 0 (Unit 1 is practicals only) | Practical evaluation | CSV operations + model evaluation |
How to Answer a “Write a Program” Question
When asked to write a Python program in an exam or practical:
- Start with a comment header —
# Program to calculate simple interest - Declare variables clearly — use meaningful names (
principal, notp) - Show the formula in a comment —
# SI = (P * R * T) / 100 - Always include
print()at the end — examiners need to see output - Write expected output — either run it or write it as a comment at the bottom
For a complete list of common Python errors and how to fix them before your practical exam, see our Top 10 Python Errors & How to Fix Them guide.
Quick Revision Box
| Term | What It Means |
|---|---|
| Variable | A named storage location that holds a value |
| Data type | The kind of value stored — int, float, str, bool |
print() | Displays output on screen |
input() | Takes input from the user (always returns a string) |
if-else | Runs different code depending on whether a condition is True or False |
for loop | Repeats code a specific number of times |
while loop | Repeats code as long as a condition remains True |
| List | An ordered collection of values stored in one variable |
| Library | Pre-written code you import to add extra features (NumPy, Pandas, etc.) |
| DataFrame | A table-like data structure in Pandas — rows and columns |
| Array | A NumPy structure for fast numerical operations |
import | Loads a library so you can use its functions |
head() | Shows first N rows of a DataFrame (default 5) |
isnull() | Checks for missing values in a DataFrame |
.fit() | Trains a machine learning model on your data |
.predict() | Uses a trained model to make new predictions |
Practice Questions
Q1 (2 marks): Write a Python program to calculate the simple interest when principal = 2000, rate of interest = 4.5, and time = 10 years.
Model Answer:
python
# Program to calculate Simple Interest
principal = 2000
rate = 4.5
time = 10

simple_interest = (principal * rate * time) / 100
print("Simple Interest:", simple_interest)
Output: Simple Interest: 900.0
Q2 (4 marks): Write a Python program using NumPy to create a list [23, 12, 5, 9, 65, 44] and calculate its mean, median, and maximum value. Display all results.
Model Answer:
python
# Program to find mean, median and maximum using NumPy
import numpy as np

data = np.array([23, 12, 5, 9, 65, 44])

print("Mean:", np.mean(data))
print("Median:", np.median(data))
print("Maximum:", np.max(data))
Expected Output:
Mean: 26.333333333333332
Median: 17.5
Maximum: 65
Q3 (MCQ): Which of the following correctly converts user input to an integer in Python?
a) x = input(int("Enter number: ")) b) x = int(input("Enter number: ")) c) x = input("Enter number: ", int) d) x = integer(input("Enter number: "))
Answer: b) x = int(input("Enter number: ")) The int() function wraps around input(), converting the returned string to an integer.
Frequently Asked Questions
Q1: Is Python taught in Class 9 theory or practical? In Class 9, Python (Unit 5: Introduction to Python) is part of the overall assessment, which includes both theory and practical components. The CBSE 2025-26 syllabus lists practical programs under Unit 5 as suggested activities. Refer to your school’s internal assessment scheme for exact mark distribution.
Q2: Do I need to install Python on my computer for Class 9? You can start without installing anything by using online Python compilers like repl.it or the editor at python.org. For Class 10 and above, Jupyter Notebook (via Anaconda) is the CBSE-recommended environment. See our Anaconda Installation Guide for CBSE AI Students for step-by-step setup instructions.
Q3: What is the difference between NumPy and Pandas? Do I need both? Yes, and they serve different purposes. NumPy is for mathematical operations on arrays of numbers — think calculations on a column of 1000 values. Pandas is for working with tables (DataFrames) — loading datasets, filtering rows, handling missing data. In practice, they work together: Pandas DataFrames are built on NumPy arrays underneath.
Q4: My program runs correctly but my teacher says the output format is wrong. Why? Presentation matters in practicals. CBSE examiners look for: (1) a comment header at the top explaining what the program does, (2) meaningful variable names, (3) print() statements with labels (e.g., print("Mean:", mean) not just print(mean)), and (4) the expected output written below the code. Programs that produce correct answers but have no structure often lose presentation marks.
Q5: Can Python skills from CBSE AI actually get me a job? Not directly at Class 12 level — but the foundation is real. Data analyst roles in India (entry level, ₹3–6 LPA) require exactly what you are learning: Pandas, Matplotlib, NumPy, and basic ML with Scikit-learn. Companies like TCS, Infosys, and Wipro run Python-based analytics projects daily. Students who complement their CBSE AI Python skills with a free IBM SkillsBuild certification (which CBSE itself recommends in Unit 3 of Class 11) have a genuinely useful credential to show in college applications and internship interviews.
Action Plan
Exam Practice Checklist
- Can you write a
print()program with variables from memory in under 2 minutes? - Can you write a working
forloop and awhileloop for the same task? - Have you practiced at least 3 list operations —
append(),remove(), indexing? - Have you run at least one NumPy program with
mean(),median(), andmax()? - Have you read a CSV file using
pd.read_csv()and displayedhead()andinfo()? - Have you created all five chart types using Matplotlib at least once?
- Have you trained a LinearRegression model and checked its MSE output?
Project Idea
Project: Student Performance Predictor
Difficulty: Class 11–12 | Tools: Pandas, Scikit-learn, Matplotlib
Build a Python program that predicts a student’s final exam marks based on attendance, assignment scores, and mid-term results.
3-Step Outline:
- Create a CSV with columns:
attendance_%,assignment_avg,midterm_marks,final_marksfor 20 students (use realistic sample data) - Load the CSV with Pandas, check for missing values, then train a LinearRegression model using
attendance_%andmidterm_marksas features - Input a new student’s attendance and midterm score and predict their likely final mark — display the result with a scatter plot showing actual vs predicted values
This project directly maps to Unit 6 (Machine Learning Algorithms) in Class 11 and the model evaluation practicals in Class 12.